. 2011 Jun;7(6):e1002106.
doi: 10.1371/journal.ppat.1002106. Epub 2011 Jun 23.

Detection of inferred CCR5- and CXCR4-using HIV-1 variants and evolutionary intermediates using ultra-deep pyrosequencing

Affiliations

Detection of inferred CCR5- and CXCR4-using HIV-1 variants and evolutionary intermediates using ultra-deep pyrosequencing

Evelien M Bunnik et al. PLoS Pathog. 2011 Jun.

Abstract

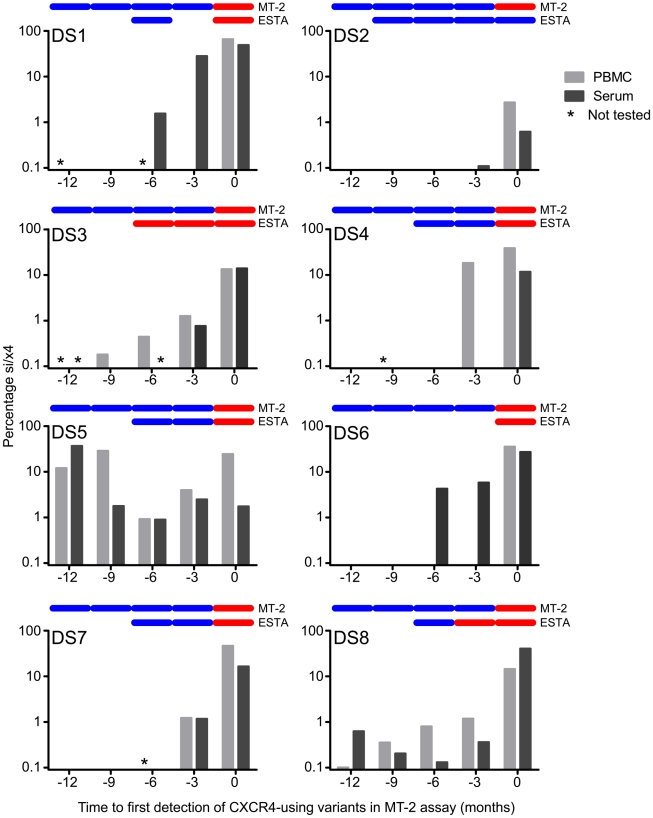
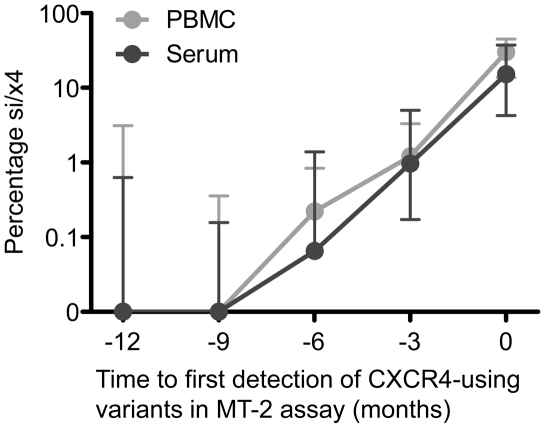
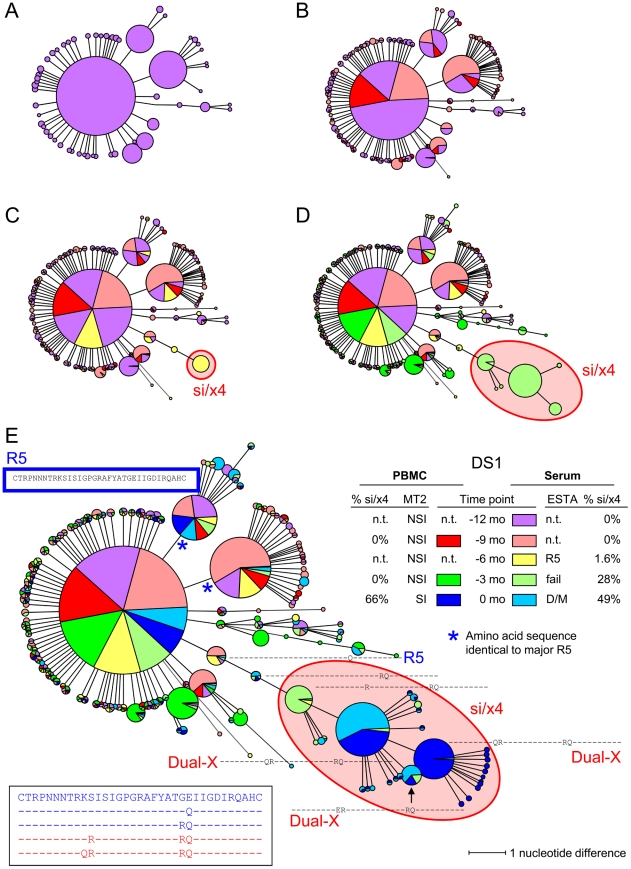
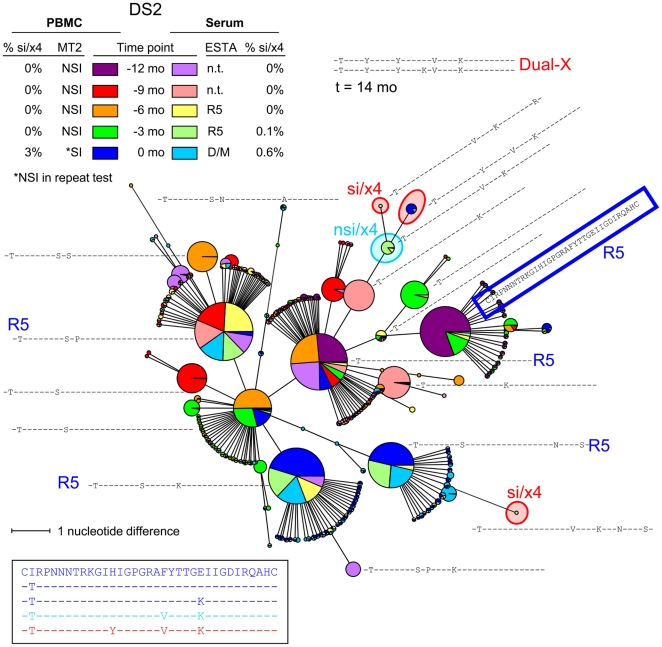
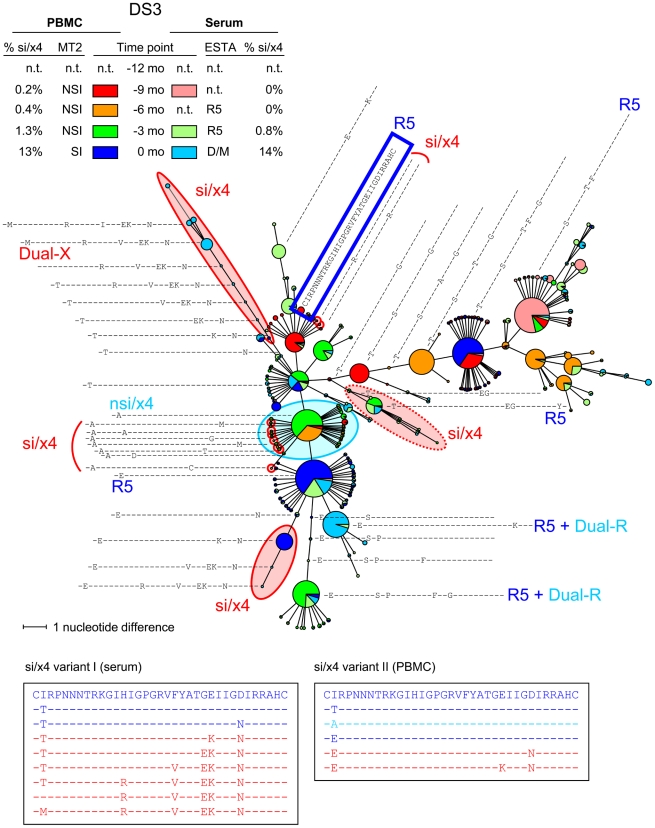
The emergence of CXCR4-using human immunodeficiency virus type 1 (HIV-1) variants is associated with accelerated disease progression. CXCR4-using variants are believed to evolve from CCR5-using variants, but due to the extremely low frequency at which transitional intermediate variants are often present, the kinetics and mutational pathways involved in this process have been difficult to study and are therefore poorly understood. Here, we used ultra-deep sequencing of the V3 loop of the viral envelope in combination with the V3-based coreceptor prediction tools PSSM(NSI/SI) and geno2pheno([coreceptor]) to detect HIV-1 variants during the transition from CCR5- to CXCR4-usage. We analyzed PBMC and serum samples obtained from eight HIV-1-infected individuals at three-month intervals up to one year prior to the first phenotypic detection of CXCR4-using variants in the MT-2 assay. Between 3,482 and 10,521 reads were generated from each sample. In all individuals, V3 sequences of predicted CXCR4-using HIV-1 were detected at least three months prior to phenotypic detection of CXCR4-using variants in the MT-2 assay. Subsequent analysis of the genetic relationships of these V3 sequences using minimum spanning trees revealed that the transition in coreceptor usage followed a stepwise mutational pathway involving sequential intermediate variants, which were generally present at relatively low frequencies compared to the major predicted CCR5- and CXCR4-using variants. In addition, we observed differences between individuals with respect to the number of predicted CXCR4-using variants, the diversity among major predicted CCR5-using variants, and the presence or absence of intermediate variants with discordant phenotype predictions. These results provide the first detailed description of the mutational pathways in V3 during the transition from CCR5- to CXCR4-usage in natural HIV-1 infection.


Conflict of interest statement

I have read the journal's policy and have the following conflicts. WH, AF, CJP and EC are employees of Monogram Biosciences. PRH is a consultant for and/or has received grant funding from Merck, ViiV Healthcare, Pfizer, Quest, Virco and Abbott.

Figures

Figure 1
Figure 1. Detection of predicted CXCR4-using variants that emerge during natural HIV-1 infection using deep sequencing.
For each participant, the percentage si/x4 sequences in PBMC (light grey bars) and serum (dark grey bars) at time points up to one year before the first phenotypic detection of CXCR4-using variants in the MT-2 assay are shown. Samples that have not been sequenced are indicated with an asterisk. In the top of each graph, the results of the MT-2 assay and the enhanced-sensitivity Trofile assay (ESTA) are given: a blue bar indicates NSI or R5, respectively, while a red bar indicates SI or D/M, respectively.
Figure 2
Figure 2. Increasing percentage of predicted CXCR4-using variants over time following their appearance during natural HIV-1 infection.
The median percentage si/x4 sequences generated from PBMC (light grey) and serum (dark grey) by deep sequencing at time points up to one year before the first phenotypic detection of CXCR4-using variants in the MT-2 assay in eight participants are shown. Error bars represent the interquartile ranges.
Figure 3
Figure 3. Minimum spanning tree (MST) of V3 sequences from subject DS1.
V3 sequences generated by deep sequencing were used to construct MSTs. Identical nucleotide sequences are grouped in one node, and the circle size is proportional to the abundance of that particular V3 sequence. The length of the connecting branches corresponds to the number of nucleotide differences between the two connected nodes. Time points are color-coded, using bright colors for PBMC samples and corresponding soft colors for serum samples. (A) MST stripped of sequences from all time points except time point −12 months. For this time point, PBMCs were not available, and the MST thus consists of V3 sequences generated from serum only (shown in light red). (B) V3 sequences from PBMCs (shown in bright orange) and serum (shown in light orange) obtained at time point −9 months were added to the MST presented in panel A. (C) MST containing V3 sequences generated from −6 months serum (shown in light yellow) in addition to the sequences present in the MST in panel B. (D) Sequences from PBMCs (bright green) and serum (light green) at timepoint −3 months have been added to the MST in panel C. (E) Complete MST containing PBMC and serum V3 sequences from all time points. V3 amino acid sequences are shown relative to the majority sequence in PBMCs at the first time point (shown in blue box). Sequences of the major nsi/r5 variant, the major si/x4 variant, and all intermediates are additionally shown in the bottom left. In all panels, nodes containing V3 sequences with an si phenotype as inferred by PSSMNSI/SI and an x4 phenotype as inferred by geno2pheno[coreceptor] are indicated in red, all other sequences were predicted to be nsi/r5. The phenotype of V3 sequences of which the corresponding Env clone was analyzed in the Trofile assay is given in bright blue (for R5 sequences) or in bright red (for Dual-X sequences). Also shown are the results of phenotyping of PBMC samples by the MT-2 assay (NSI or SI) and of serum samples by ESTA (R5 or D/M), and the percentages si/x4 sequences obtained from PBMC and serum samples by deep sequencing (panel E, right side). N.t., not tested; mo, months.
Figure 4
Figure 4. Relatively large variation among major nsi/r5 variants over time in subject DS2.
An MST of all V3 sequences generated from PBMC and serum samples of all time points is shown. See the legend to Figure 3 for details regarding the layout of the figure. Nodes containing V3 sequences with an si phenotype as inferred by PSSMNSI/SI and an x4 phenotype as inferred by geno2pheno[coreceptor] are indicated in red, nodes containing discordant nsi/x4 variants are indicated in light blue, while all other sequences were predicted to be nsi/r5. As Dual-X clones were not detected in the Trofile assay until 18 months after the first MT-2+ time point, the V3 sequences of two Dual-X clones from this later time point are indicated in the top. These Dual-X sequences are closely related to the si/x4 sequences present at time point zero, suggesting that these si/x4 sequences indeed form the start of the major si/x4 branch in the tree. Mo, months; n.t., not tested.
Figure 5
Figure 5. Multiple si/x4 variants emerge in subject DS3.
An MST of all V3 sequences generated from PBMC and serum samples of all time points is shown. See the legend to Figure 3 for details regarding the layout of the figure. Nodes containing V3 sequences with an si phenotype as inferred by PSSMNSI/SI and an x4 phenotype as inferred by geno2pheno[coreceptor] are indicated in red, nodes containing discordant nsi/x4 variants are indicated in light blue, while all other sequences were predicted to be nsi/r5. Two distinct si/x4 branches and several minor si/x4 variants can be observed in this MST, which are described in more detail in the text. In addition, one branch contains V3 sequences with a predicted si/x4 phenotype which were reported R5 in the Trofile assay (indicated by dotted red oval). N.t., not tested; mo, months.

References

    1. Zhu T, Mo H, Wang N, Nam DS, Cao Y, et al. Genotypic and phenotypic characterization of HIV-1 in patients with primary infection. Science. 1993;261:1179–1181. - PubMed
    1. Van 't Wout AB, Kootstra NA, Mulder-Kampinga GA, brecht-van LN, Scherpbier HJ, et al. Macrophage-tropic variants initiate human immunodeficiency virus type 1 infection after sexual, parenteral, and vertical transmission. J Clin Invest. 1994;94:2060–2067. - PMC - PubMed
    1. Keele BF, Giorgi EE, Salazar-Gonzalez JF, Decker JM, Pham KT, et al. Identification and characterization of transmitted and early founder virus envelopes in primary HIV-1 infection. Proc Natl Acad Sci U S A. 2008;105:7552–7557. - PMC - PubMed
    1. Salazar-Gonzalez JF, Salazar MG, Keele BF, Learn GH, Giorgi EE, et al. Genetic identity, biological phenotype, and evolutionary pathways of transmitted/founder viruses in acute and early HIV-1 infection. J Exp Med. 2009;206:1273–1289. - PMC - PubMed
    1. Schuitemaker H, Koot M, Kootstra NA, Dercksen MW, De Goede REY, et al. Biological phenotype of human immunodeficiency virus type 1 clones at different stages of infection: progression of disease is associated with a shift from monocytotropic to T-cell-tropic virus populations. J Virol. 1992;66:1354–1360. - PMC - PubMed

Publication types

LinkOut - more resources