Comparative Study
. 2011 Jun;7(6):e1002147.
doi: 10.1371/journal.pgen.1002147. Epub 2011 Jun 23.

Extracellular matrix dynamics in hepatocarcinogenesis: a comparative proteomics study of PDGFC transgenic and Pten null mouse models

Affiliations
Comparative Study

Extracellular matrix dynamics in hepatocarcinogenesis: a comparative proteomics study of PDGFC transgenic and Pten null mouse models

Keane K Y Lai et al. PLoS Genet. 2011 Jun.

Abstract

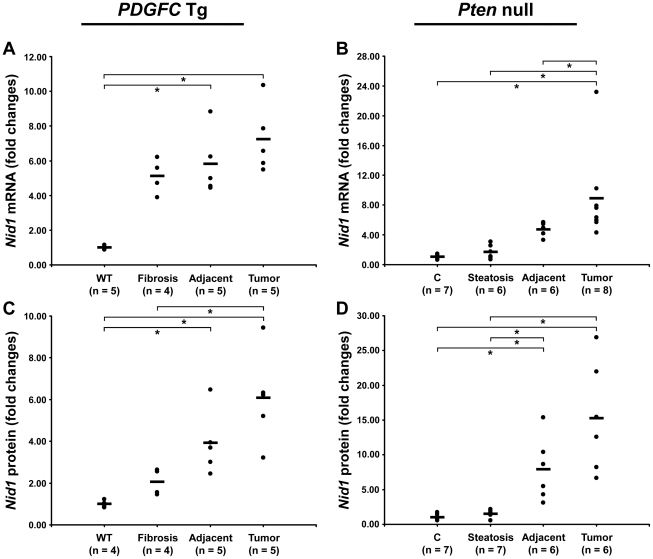
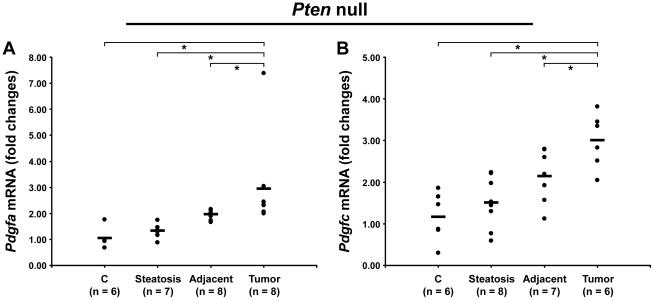
We are reporting qualitative and quantitative changes of the extracellular matrix (ECM) and associated receptor proteomes, occurring during the transition from liver fibrosis and steatohepatitis to hepatocellular carcinoma (HCC). We compared two mouse models relevant to human HCC: PDGFC transgenic (Tg) and Pten null mice, models of disease progression from fibrosis and steatohepatitis to HCC. Using mass spectrometry, we identified in the liver of both models proteins for 26 collagen-encoding genes, providing the first evidence of expression at the protein level for 16 collagens. We also identified post-transcriptional protein variants for six collagens and lysine hydroxylation modifications for 14 collagens. Tumor-associated collagen proteomes were similar in both models with increased expression of collagens type IV, VI, VII, X, XIV, XV, XVI, and XVIII. Splice variants for Col4a2, Col6a2, Col6a3 were co-upregulated while only the short form of Col18a1 increased in the tumors. We also identified tumor specific increases of nidogen 1, decorin, perlecan, and of six laminin subunits. The changes in these non-collagenous ECM proteins were similar in both models with the exception of laminin β3, detected specifically in the Pten null tumors. Pdgfa and Pdgfc mRNA expression was increased in the Pten null liver, a possible mechanism for the similarity in ECM composition observed in the tumors of both models. In contrast and besides the strong up-regulation of integrin α5 protein observed in the liver tumors of both models, the expression of the six other integrins identified was specific to each model, with integrins α2b, α3, α6, and β1 up-regulated in Pten null tumors and integrins α8 and β5 up-regulated in the PDGFC Tg tumors. In conclusion, HCC-associated ECM proteins and ECM-integrin networks, common or specific to HCC subtypes, were identified, providing a unique foundation to using ECM composition for HCC classification, diagnosis, prevention, or treatment.


Conflict of interest statement

The authors have declared that no competing interests exist.

Figures

Figure 1
Figure 1. Collagen deposition and tumor morphology in PDGFC Tg and Pten null liver.
A) Masson's trichrome stained liver sections showing hepatic pericellular collagen deposition in 6-month-old PDGFC Tg and Pten null mice compared to WT littermates and control mice. Black star: lipid droplets in Pten null livers; CV: central vein. B) H&E stained liver sections showing HCC formation in a 8-month-old PDGFC Tg mouse detected by ultrasound, and HCC and CC formation in a 9-month-old Pten null mouse. Magnification: ×200.
Figure 2
Figure 2. Collagen proteins up-regulated in PDGFC Tg fibrotic liver.
The figure includes the collagens identified as up-regulated in PDGFC Tg fibrotic liver compared to PDGFC Tg tumors and WT liver. For each protein, the abundance is shown as the total number of tandem mass spectra assigned to that protein. The collagens of high abundance are shown in panel A and those of lower abundance are shown in panel B.
Figure 3
Figure 3. Collagen proteins up-regulated in PDGFC Tg and Pten null tumors.
A,B) The figure includes the collagens identified as up-regulated in PDGFC Tg tumors compared to PDGFC Tg fibrotic and WT liver. C,D) The figure includes the collagens identified as up-regulated in Pten null tumors compared to Pten null steatotic and control liver. For each protein, the abundance is shown as the total number of tandem mass spectra assigned to that protein. The collagens of high abundance are shown in panels A and C and those of lower abundance are shown in panels B and D.
Figure 4
Figure 4. Up-regulation of Col4a2 and Col15a1 mRNAs in PDGFC Tg and Pten null tumors.
A,C) Expression of Col4a2 and Col15a1 mRNAs was measured by quantitative PCR in PDGFC Tg fibrotic liver, in PDGFC Tg tumor and adjacent tissue, and in age-matched WT liver. B,D) Similarly, expression of Col4a2 and Col15a1 mRNAs was measured in Pten null steatotic liver, in Pten null tumor and adjacent tissue, and in age-matched control liver. Expression in the disease groups is represented as fold changes over the mean of expression in the control groups.
Figure 5
Figure 5. Identification of peptides specific to post-transcriptional variants for Col1a1, Col6a2, Col6a3, and Col18a1.
The figure shows the exon structures of post-transcriptional variants for Col1a1, Col6a2, Col6a3 and Col18a1 and the associated specific peptides identified by mass spectrometry in the PDGFC Tg and Pten null liver.
Figure 6
Figure 6. Expression of Col6a2 mRNA variants upon disease progression in PDGFC Tg and Pten null liver.
A,C) Expression of Col6a2 mRNA splice variants was measured by quantitative PCR in PDGFC Tg fibrotic liver, in PDGFC Tg tumor and adjacent tissue and in age-matched WT liver. B,D) Similarly, expression of Col6a2 mRNA splice variants was measured in Pten null steatotic liver, in Pten null tumor and adjacent tissue and in age-matched control liver. Expression in the disease groups is represented as fold changes over the mean of expression in the control groups.
Figure 7
Figure 7. Expression of Col18a1 mRNA variants upon disease progression in PDGFC Tg and Pten null liver.
A,C) Expression of Col18a1 mRNA variants NC1-764 and NC1-301 was measured by quantitative PCR in PDGFC Tg fibrotic liver, in PDGFC Tg tumor and adjacent tissue and in age-matched WT liver. B,D) Similarly, expression of Col18a1 mRNA variants NC1-764 and NC1-301 was measured in Pten null steatotic liver, in Pten null tumor and adjacent tissue and in age-matched control liver. Expression in the disease groups is represented as fold changes over the mean of expression in the control groups.
Figure 8
Figure 8. Percentage of peptides with lysine hydroxylation identified for COL1A1, COL1A2, COL3A1, and COL6A2.
In A) PDGFC Tg fibrotic (F) and tumors (T) and in B) Pten null steatotic liver (S) and tumors (T).
Figure 9
Figure 9. Non-collagenous ECM proteins up-regulated in PDGFC Tg and Pten null tumors.
A) The figure includes the non-collagenous ECM proteins identified as up-regulated in PDGFC Tg tumors compared to PDGFC Tg fibrotic liver. B) The figure includes the non-collagenous ECM proteins identified as up-regulated in Pten null tumors compared to Pten null steatotic liver. For each protein, the abundance is shown as the total number of tandem mass spectra assigned to that protein.
Figure 10
Figure 10. Up-regulation of laminin α5 mRNA in PDGFC Tg and Pten null tumors.
A) Expression of laminin α5 (Lama5) mRNA was measured by quantitative PCR in PDGFC Tg fibrotic liver, in PDGFC Tg tumor and adjacent tissue, and in age-matched WT liver. B) Similarly, expression of laminin α5 (Lama5) mRNA was measured in Pten null steatotic liver, in Pten null tumor and adjacent tissue, and in age-matched control liver. Expression in the disease groups is represented as fold changes over the mean of expression in the control groups.
Figure 11
Figure 11. Up-regulation of nidogen 1 mRNA and protein in PDGFC Tg and Pten null tumors.
A,C) Expression of nidogen 1 mRNA and protein was measured by quantitative PCR and Western-blot, in PDGFC Tg fibrotic liver, in PDGFC Tg tumor and adjacent tissue and in age-matched WT liver. B,D) Similarly, expression of nidogen 1 mRNA and protein was measured in Pten null steatotic liver, in Pten null tumor and adjacent tissue, and in age-matched control liver. Expression in the disease groups is represented as fold changes over the mean of expression in the control groups.
Figure 12
Figure 12. Up-regulation of Pdgfa and Pdgfc mRNAs in Pten null tumors.
Expression of A) Pdgfa mRNA and B) Pdgfc mRNA was measured in Pten null steatotic liver, in Pten null tumor and adjacent tissue, and in age-matched control liver. Expression in the disease groups is represented as fold changes over the mean of expression in the control groups.
Figure 13
Figure 13. CD44 and integrin proteins up-regulated in PDGFC Tg and Pten null tumors.
A) The figure includes CD44 and the integrin subunits identified up-regulated in PDGFC Tg tumors compared to PDGFC Tg fibrotic liver. B) The figure includes CD44 and the integrin subunits identified as up-regulated in Pten null tumors compared to Pten null steatotic liver. For each protein, the abundance is shown as the total number of tandem mass spectra assigned to that protein.
Figure 14
Figure 14. Expression of integrin α6 and α8 mRNAs upon disease progression in PDGFC Tg and Pten null liver.
A,C) Expression of Itga6 and Itga8 mRNAs was measured by quantitative PCR in PDGFC Tg fibrotic liver, in PDGFC Tg tumor and adjacent tissue, and in age-matched WT liver. B,D) Similarly, expression of Itga6 and Itga8 mRNAs was measured in Pten null steatotic liver, in Pten null tumor and adjacent tissue, and in age-matched control liver. Expression in the disease groups is represented as fold changes over the mean of expression in the control groups.
Figure 15
Figure 15. Schema summarizing the ECM protein components and their receptors identified as up-regulated in PDGFC Tg and Pten null tumors.
All ECM proteins and associated receptors identified as up-regulated in the mice tumors are shown as follows: in black for collagens, in blue for non-collagenous ECM proteins and in red for ECM receptors. Their position in the graph indicates whether they were commonly identified in the tumors of both mouse models (overlapping section between the light green oval representing the Pten null tumors and the light blue square representing the PDGFC Tg tumors) or identified specifically in one tumor type (light green section for Pten null tumors and light blue section for PDGFC Tg tumors). These two latter non-overlapping sections of the graph also indicate ratios of selected proteins that may have utility in discriminating between the PDGFC Tg and the Pten null tumors. The proteins in bold are those identified with higher abundance.

References

    1. El-Serag HB, Rudolph KL. Hepatocellular carcinoma: epidemiology and molecular carcinogenesis. Gastroenterology. 2007;132:2557–2576. - PubMed
    1. Reigstad LJ, Varhaug JE, Lillehaug JR. Structural and functional specificities of PDGF-C and PDGF-D, the novel members of the platelet-derived growth factors family. FEBS J. 2005;272:5723–5741. - PubMed
    1. Bataller R, Brenner DA. Liver fibrosis. J Clin Invest. 2005;115:209–218. - PMC - PubMed
    1. Campbell JS, Hughes SD, Gilbertson DG, Palmer TE, Holdren MS, et al. Platelet-derived growth factor C induces liver fibrosis, steatosis, and hepatocellular carcinoma. Proc Natl Acad Sci U S A. 2005;102:3389–3394. - PMC - PubMed
    1. Fausto N, Campbell JS. Mouse models of hepatocellular carcinoma. Semin Liver Dis. 2010;30:87–98. - PubMed

Publication types

MeSH terms