. 2011;6(6):e21211.
doi: 10.1371/journal.pone.0021211. Epub 2011 Jun 22.

An information theoretic, microfluidic-based single cell analysis permits identification of subpopulations among putatively homogeneous stem cells

Affiliations

An information theoretic, microfluidic-based single cell analysis permits identification of subpopulations among putatively homogeneous stem cells

Jason P Glotzbach et al. PLoS One. 2011.

Abstract

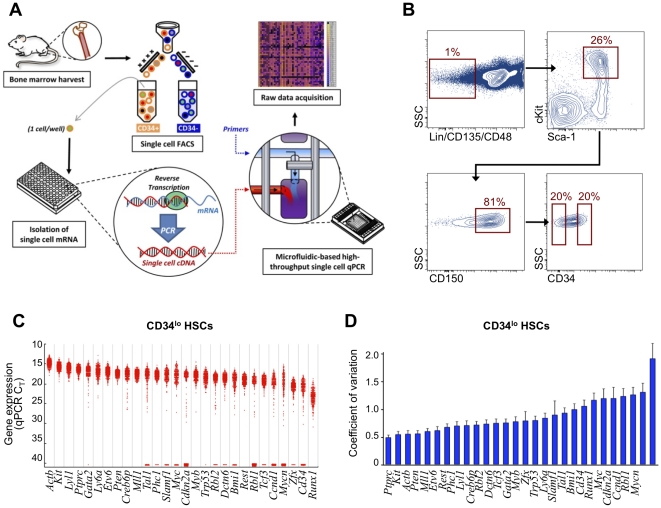
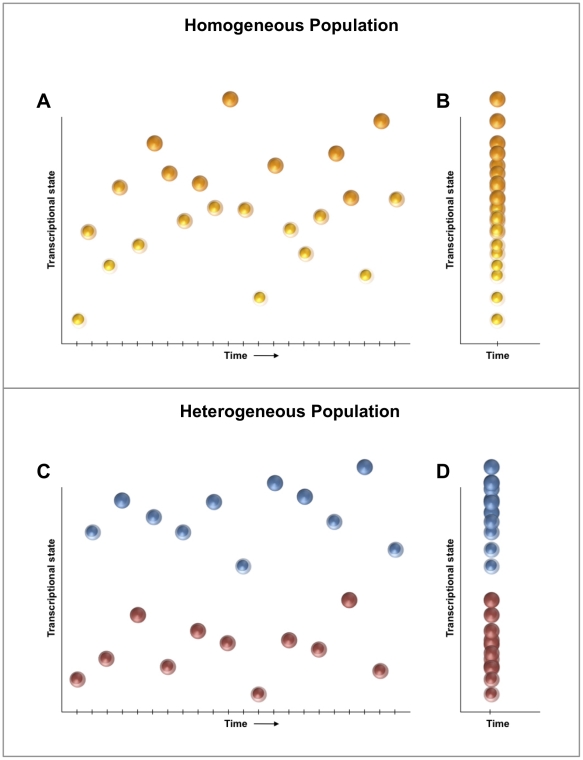
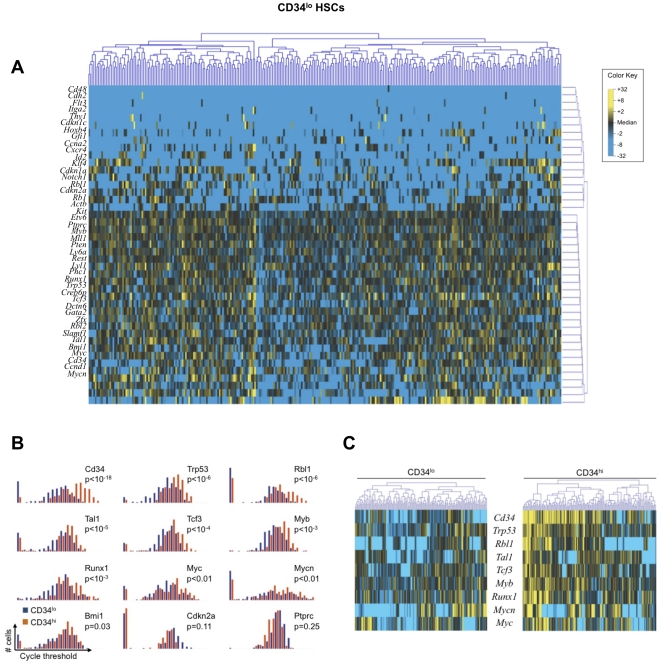
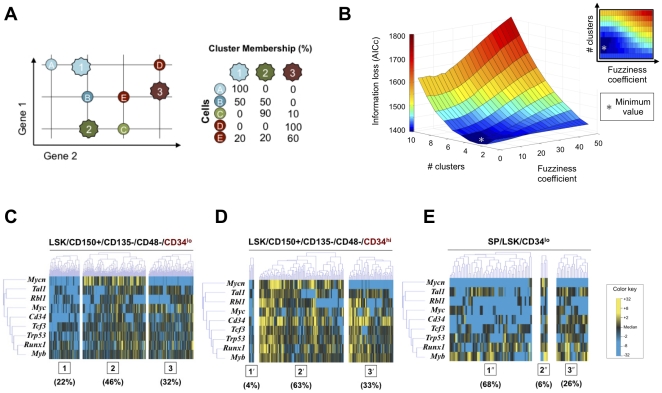
An incomplete understanding of the nature of heterogeneity within stem cell populations remains a major impediment to the development of clinically effective cell-based therapies. Transcriptional events within a single cell are inherently stochastic and can produce tremendous variability, even among genetically identical cells. It remains unclear how mammalian cellular systems overcome this intrinsic noisiness of gene expression to produce consequential variations in function, and what impact this has on the biologic and clinical relevance of highly 'purified' cell subgroups. To address these questions, we have developed a novel method combining microfluidic-based single cell analysis and information theory to characterize and predict transcriptional programs across hundreds of individual cells. Using this technique, we demonstrate that multiple subpopulations exist within a well-studied and putatively homogeneous stem cell population, murine long-term hematopoietic stem cells (LT-HSCs). These subgroups are defined by nonrandom patterns that are distinguishable from noise and are consistent with known functional properties of these cells. We anticipate that this analytic framework can also be applied to other cell types to elucidate the relationship between transcriptional and phenotypic variation.


Conflict of interest statement

Competing Interests: The authors have declared that no competing interests exist.

Figures

Figure 1
Figure 1. Single cell gene expression analysis demonstrates transcriptional variation in murine LT-HSCs.
(A) Schematic of high throughput microfluidic chip-based single cell transcriptional analysis. A single cell is sorted by FACS into each well of a 96-well plate that has been preloaded with RT-PCR reagents (see methods for complete description). A low-cycle RT-PCR pre-amplification step creates cDNA for each gene target within each individual cell. Single cell cDNA is then loaded onto the microfluidics chip along with the primer-probe sets for each gene target. The BioMark machine performs qPCR for each cell across all 48 gene targets in parallel, resulting in 2,304 data points for each chip run. (B) FACS sorting parameters of two populations of HSCs isolated from primary murine bone marrow. All cells were LSK (Linneg Sca-1+ cKit+) CD48 CD135CD150+ and were sorted into two distinct populations based on CD34 expression (CD34lo and CD34hi). SSC  =  side scatter. (C) Histogram presenting raw qPCR cycle threshold values for individual genes across 300 LT-HSCs. Each dot represents a single gene/cell qPCR reaction, with increased cycle threshold values corresponding to decreased mRNA content. Cycle threshold values of 40 were assigned to all reactions that failed to achieve detectable levels of amplification within 40 qPCR cycles. For convenience, genes that failed to amplify in the majority of cells have been omitted (see Figure S1 for complete dataset). (D) Single-gene coefficient of variance (COV) values for individual CD34lo HSCs. Error bars represent standard deviations derived through bootstrapping over 100,000 iterations as previously described .
Figure 2
Figure 2. A transcriptional distribution-based model of population homogeneity.
Given the noisiness inherent to transcription, an individual cell will exhibit a variable transcriptional signature if measured precisely over time (A). A cell population can be considered “homogeneous” if all individual cell transcriptomes are governed by identical steady-state probability functions (i.e. all cells are drawn from a single probability field). It follows that the transcriptional fingerprint of a homogeneous population measured at a single timepoint (B) should, through the transcriptional states of all individual cells, recapitulate the single distribution observed for any one cell measured across multiple time points (A). By contrast, if the distribution of individual cell transcriptomes from a population at a single timepoint (D) more closely reflect that of two (or more) independent probability functions (C), then the population may be designated as heterogeneous.
Figure 3
Figure 3. A multivariate, information-theoretic approach permits characterization of patterns in higher-order correlated gene expression.
(A) Hierarchical clustering of simultaneous expression of 43 genes among 300 individual CD34lo HSCs. Gene expression is presented as fold change from median on a color scale from yellow (high expression, 32-fold above median) to blue (low expression, 32-fold below median). (B) Differentially-expressed genes between CD34lo and CD34hi HSCs identified using non-parametric two sample Kolmogorov-Smirnov testing. Nine genes exhibit significantly different (p < 0.01 following Bonferroni correction for multiple comparisons) distributions of single cell expression between the two populations, illustrated here using median-centered histograms (bin size  =  0.5 qPCR cycle thresholds). (C) Comparison of CD34lo and CD34hi populations. Cells are clustered hierarchically based on a Kolmogorov-Smirnov-significant gene subset.
Figure 4
Figure 4. Optimized partitive modeling of LT-HSC single cell transcriptional data.
(A) Individual cells are clustered within a hypothetical 2-gene space (represented by horizontal and vertical axes). Fuzzy c-means clustering allows shared membership of an individual cell within two or more clusters. Cluster centers (k1, k2, k3) are determined based on the similarities across all cells in the sample. A “fuzziness coefficient” modulates the degree to which partial membership is encouraged among clusters. (B) Iterative application of Akaike Information Criterion (with a second order correction for small sample sizes [44]) to determine optimal clustering parameters. An exhaustive approach was used to determine the information loss (z-axis) associated with different permutations of the number of clusters (y-axis) and the fuzziness coefficient (x-axis). The trough of the three dimensional plot (grey asterisk) represents the optimal set of clustering parameters for the given data set that will minimize theoretical information loss. (C–E) Fuzzy c-means clustering of HSC single cell transcriptional data using the optimal clustering parameters (3 clusters and a fuzziness coefficient of 1.05). Only the Kolmogorov Smirnov-significant genes (Figure 3B) are displayed for visual simplicity. Cluster centroids are determined based on partitioning of the CD34lo cells and applied across the other two experimental groups. (C) CD34lo HSCs are relatively evenly distributed across the three clusters. (D) CD34hi HSCs demonstrate a substantially different distribution. Membership in cluster 1′ is limited to 4% of the cells and cluster 2′ membership is the most common. (E) Side population CD34lo HSCs would be expected to be substantially enriched for HSC capacity and should resemble the CD34lo HSCs. Membership in cluster 1′′ is significantly expanded, suggesting that cells in this subpopulation are characteristic of highly enriched LT-HSCs.

References

    1. Rosenfeld S. Patterns of stochastic behavior in dynamically unstable high-dimensional biochemical networks. Gene Regul Syst Bio. 2009;3:1–10. - PMC - PubMed
    1. Bar-Even A, Paulsson J, Maheshri N, Carmi M, O'Shea E, et al. Noise in protein expression scales with natural protein abundance. Nat Genet. 2006;38:636–643. - PubMed
    1. Elowitz MB, Levine AJ, Siggia ED, Swain PS. Stochastic gene expression in a single cell. SCIENCE. 2002;297:1183–1186. - PubMed
    1. Levsky JM, Shenoy SM, Pezo RC, Singer RH. Single-cell gene expression profiling. SCIENCE. 2002;297:836–840. - PubMed
    1. Ozbudak EM, Thattai M, Kurtser I, Grossman AD, van Oudenaarden A. Regulation of noise in the expression of a single gene. Nat Genet. 2002;31:69–73. - PubMed

Publication types