. 2011;6(6):e21250.
doi: 10.1371/journal.pone.0021250. Epub 2011 Jun 22.

Transformation of human mesenchymal cells and skin fibroblasts into hematopoietic cells

Affiliations

Transformation of human mesenchymal cells and skin fibroblasts into hematopoietic cells

David M Harris et al. PLoS One. 2011.

Abstract

Patients with prolonged myelosuppression require frequent platelet and occasional granulocyte transfusions. Multi-donor transfusions induce alloimmunization, thereby increasing morbidity and mortality. Therefore, an autologous or HLA-matched allogeneic source of platelets and granulocytes is needed. To determine whether nonhematopoietic cells can be reprogrammed into hematopoietic cells, human mesenchymal stromal cells (MSCs) and skin fibroblasts were incubated with the demethylating agent 5-azacytidine (Aza) and the growth factors (GF) granulocyte-macrophage colony-stimulating factor and stem cell factor. This treatment transformed MSCs to round, non-adherent cells expressing T-, B-, myeloid-, or stem/progenitor-cell markers. The transformed cells engrafted as hematopoietic cells in bone marrow of immunodeficient mice. DNA methylation and mRNA array analysis suggested that Aza and GF treatment demethylated and activated HOXB genes. Indeed, transfection of MSCs or skin fibroblasts with HOXB4, HOXB5, and HOXB2 genes transformed them into hematopoietic cells. Further studies are needed to determine whether transformed MSCs or skin fibroblasts are suitable for therapy.


Conflict of interest statement

Competing Interests: The authors have declared that no competing interests exist.

Figures

Figure 1
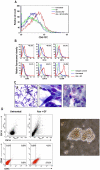
Figure 1. Aza and GF induce hematopoietic cell surface marker expression.
(A) Incubation of HS-5 cells with Aza induced the expression of CD45 in 21.3% of the cells, whereas incubation with Aza plus GF induced CD45 in 41.6% of the cells. Untreated cells did not express CD45, and incubation of HS-5 cells with GF alone did not affect CD45 expression. (B) In another experiment using the same culture conditions, 11.1% of the total population of Aza plus GF–treated HS-5 cells expressed CD45. In addition, a significant percentage of the total population of treated HS-5 cells expressed T-, myeloid-, and B-cell surface markers (CD3, CD14, and CD19, respectively). In addition, the levels of both the GM-CSF receptor (CD116) and the adhesion molecule (CD184) were upregulated. The curves of both untreated and treated cells stained with the isotype antibody overlapped. Therefore only one isotype control curve is depicted. (C) Aza plus GF–treated HS-5 cells became round and non-adherent. Untreated HS-5 cells (Write-Giemsa stain, X 100 magnification) show classical morphological features of elongated spindle like cells (a), a X10 magnification of the cells is shown in the insert (b), and panel (c) shows that Aza plus GF–treated HS-5 cells (Write-Giemsa stain of cytospun nonadherent cells, X 1000 magnification) are round, heterogeneous in size and some of them have cytoplasmic granules. (D) Left panel: a two-color flow cytometry analysis demonstrated that 4.1% of viable HS-5 cells treated with Aza plus GF (assessed by side (SSC-H) and forward (FSC-H) scatter analysis; top panel) co-expressed CD45 and CD34 antigens. Right panel: a typical BFU-E colony derived from Aza plus GF–treated HS-5 cells grown in methylcellulose.
Figure 2
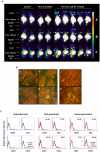
Figure 2. Transformed HS-5 cells engraft and sustain hematopoiesis in NOD-Scid mice.
(A) Gamma camera imaging studies of NOD-Scid mice. Frontal (a, b) and lateral (c) views 3 days (a) and 3 weeks (b and c) after intravenous injection of 105 untreated or Aza plus GF–treated HS-5 cells, stably transfected with hemagglutinin-A-tagged human somatostatin receptor 2A (SSTR2A) gene. Thirteen MBq (350 µCi) 111indium-octreotide was injected intravenously 24 hr prior to imaging. Radioactive signals were detected only in the bladder and kidneys of mice that had not been injected with HS-5 cells (control; first two columns). In contrast, radioactive signals were detected in the calvaria and spine at 3 days (a) and the limbs and/or spine at 3 weeks (b, c) after injection of Aza plus GF–treated HS-5 cells in 8 out of 8 animals (images of 5 animals are depicted). Limb and spine signals were prominently increased after 3 weeks. Weak signals were detected at 3 weeks in the spines of mice that were injected with untreated HS-5 cell (columns 3 and 4; 2 of 4 animals are depicted). (B) Left panel: HLA-ABC immunofluorescence of bone marrow smears obtained from NOD-Scid mice 3 weeks after intravenous injection of untreated and Aza plus GF-treated HS-5 cells. Eight mice were injected with Aza plus GF-treated HS-5 cells and 8 mice with untreated HS-5 cells. Bone marrow analysis was performed separately on every mouse. Representative data are depicted. Random fields were scanned and a total of 400 cells, either HLA-positive or -negative, were counted. As shown in panel (d), 18.5% of marrow cells of mice injected with Aza plus GF-treated HS-5 cells were HLA-ABC positive. White arrows point to the positive cells. The insert is a magnification of an HLA-ABC-positive cell. The large cell (arrow head) is a micro-megakaryocyte. No positive staining was detected when slides of marrow cells from Aza plus GF-treated HS-5 cells were stained with the isotype antibody (a) or on slides of marrow cells obtained from mice that were injected with untreated cells (b) or mice that received no injection (c). Right panel depicts a field (X 1000) of HLA-ABC-stained bone marrow cells from a mouse that were injected with Aza plus GF-treated HS-5 cells (right) and a field of HLA-ABC-stained bone marrow cells from mouse that was injected with untreated HS-5 cells (left). (C) Flow cytometry analysis of bone marrow cells obtained either from untreated mice, mice that were injected with 105 Aza plus GF-treated HS-5 cells (First generation) or bone marrow cells that were harvested three weeks after injection of 105 first generation bone marrow cells (Second generation). Black line depicts the isotypic control and the percent of antigen-positive cells is depicted in the right upper corners. Similar results were obtained in two different experiments. This analysis was conducted twice with each cohort. Representative results are depicted.
Figure 3
Figure 3. Transdifferentiation of normal marrow MSCs into hematopoietic cells.
(A) Normal bone marrow MSCs were expanded in culture until all cells were of non-hematopoietic origin. The cells did not express either CD45 or the early stem/progenitor surface marker CD338. Then the cells were incubated with Aza, GF, or both and harvested and stained with rabbit anti-human CD45 antibodies. Only cells that were exposed to both Aza and GF expressed CD45. (B) The same experiment was conducted on MSCs derived from bone marrow cells of three additional donors (MSCs of donor 3 were studied twice). In these experiments, CD45 was detected in cells that were exposed to Aza alone. However, significantly higher CD45 expression was found in cells that were treated with Aza plus GF. (C) Unlike the elongated untreated MSCs that grew in an adherent monolayer, Aza plus GF-treated normal marrow MSCs gave rise to hematopoietic colony-forming cells. Transformed cells were grown in methylcellulose in the presence of GM-CSF, SCF and erythropoietin and gave rise to CFU-GM, BFU-E and CFU-GEMM colonies. The figure depicts a typical BFU-E colony.
Figure 4
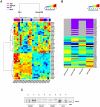
Figure 4. Transdifferentiated mesenchymal cell mRNA and DNA methylation analysis.
(A) Heatmap of Agilent mRNA expression data. Both rows (genes) and columns (samples) are clustered using the Ward linkage rule and Pearson correlation to define similarity. Some genes were evaluated using 2 or more probes. The dominant signal in the data is the split between HS-5 cells (left branch) and normal bone marrow MSCs (right branch). A secondary signal, particularly prevalent in the HS-5 cells, is driven by the effects of treatment with or without Aza. (B) Methylation status of hematopoietic genes. The top portion shows genes that were completely unmethlyated in at least one sample (purple, hypomethylated; gray, methylated). The completely unmethylated genes were omitted before normalization. The bottom portion shows the normalized log ratios from the methylation arrays (blue, weakly methylated; red, strongly methylated). (C) RT-PCR studies detected a significant increase in the expression of HOXB4 and HOXB5, but not HOXB2, genes following treatment of HS-5 cells with Aza plus GF. C, control (untreated) cells; T, Aza plus GF-treated cells.
Figure 5
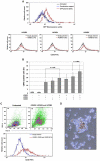
Figure 5. HOXB gene transfection transforms HS-5 cells into hematopoietic cells.
(A) The top panel shows that a 50% transfection efficiency with GFP-tagged plasmid. In all experiments, 40–50% transfection efficiency was obtained. The bottom panel shows that whereas only a marginal change in CD45 expression could be attained by transfection with HoxB2, transfection with HoxB4 and HoxB5 induced CD45 expression in 15.5% and 17.9% of cells, respectively. (B) In three separate experiments, transfection of HS-5 cells with HOXB4 or HOXB5, but not HOXB2, induced CD45 expression. However, co-transfection of HOXB2 with HOXB4, or HOXB2 with HOXB4 and HOXB5, both increased the percentage of cells expressing CD45. The figure depicts the means±S.D. of the percentage of CD45-positive cells. (C) Transfection with HOXB2, HOXB4, and HOXB5 altered HS-5 cells. The transfected cells became round and small (top panel, right) as compared with untransfected cells (top panel, left) as assessed by side (SSC-H) and forward (FSC-H) scatter analysis, and 51% of the cells expressed CD45 (bottom panel). (D) HS-5 cells transfected with HOXB2, HOXB4, and HOXB5 formed hematopoietic colonies when grown in the CFU-GEMM colony culture assay. A mixed colony containing erythroid, granulocytic and monocyte-macrophage cells is depicted.
Figure 6
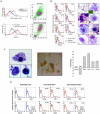
Figure 6. Transformation of skin fibroblasts into hematopoietic cells that engraft in NOD-Scid mice.
(A) A 43% transfection efficiency of fibroblasts was attained with GFP-tagged plasmid (left, upper panel). Following transfection with HOXB2, HOXB4, and HOXB5, 55% of the cells transformed into CD45-positive cells (left, lower panel). The transformed cells became small and round (right, lower panel) as compared with untransfected skin fibroblasts (right, upper panel). (B) Left panel: In a different experiment of co-transfection of skin fibroblasts with HOXB2, HOXB 4, and HOXB5 genes, flow cytometry analysis of transfected skin fibroblasts showed that a significant percentage of the total population of the cells expressed the hematopoietic CD45 surface antigen, T-, myeloid-, and B-cell surface markers (CD3, CD14, and CD19, respectively), the immature hematopoietic cell marker CD34, the GM-CSF receptor CD116, and the adhesion molecule CD184 antigens. The percentage of positive cells is depicted in the right upper corner of each figure. The curves of both untreated and transfected cells stained with the isotype antibody overlapped. Therefore only one isotype control curve is depicted. Right panel: Morphological analysis of transfected skin fibroblasts cytospun onto glass slides and stained with Wright-Giemsa demonstrated typical hematologic cell characteristics: (a) cultured untreated skin fibroblasts (X 100 magnification); (b) immature myeloid and lymphoid blasts (insert shows TdT nuclear immunofluorescent staining). The red depicts DNA (propidium iodide stain) and the bright green is nuclear TdT in lymphoblasts (X 1000); (c) mature granulocyte (X 1000). Insert shows an early granulocyte precursor immuno-stained with anti-Kit antibodies (X 1000); (d) a monocyte (X 500) insert shows a monocyte stained with butyrate; (e) a megakaryocyte with platelet membrane demarcations (X 500); (f) normoblasts stained with glycophorine A (X 1000); (g) a lymphocyte (X 1000); (h) a plasma cell (X 1000) with cytoplasmic inclusions (Russell bodies). (C) Left panel: skin fibroblasts transfected with HoxB genes differentiate into functional myeloid cells. Three cells (X 100) expressing NBT (dark blue dots) are depicted. Middle panel: skin fibroblasts transfected with HoxB genes form hematopoietic colonies in 4 different experiments. A BFU-E colony grown in the CFU-GEMM colony culture assay is depicted. Right panel: transfection of HoxB2, HoxB4 and HoxB5 genes alters skin fibroblast gene expression. Results of qRT-PCR analysis of Thy-1, gata3, Lmo2, Pu.1, and Runx2 gene levels are depicted as fold change (decrease or increase) relative to mRNA levels in empty plasmid-transfected cells. Data from three different experiments are depicted. The means±S.D. of changes in mRNA levels are shown. (D) Flow cytometry analysis of bone marrow cells obtained either from untreated NOD-Scid mice, NOD-Scid mice that were injected with 105 HOXB2-, HOXB4- and HOXB5-transfected skin fibroblasts (First generation), or bone marrow cells that were harvested three weeks after injection of 105 first generation bone marrow cells (Second generation). Black line depicts the isotypic control and the percent of antigen-positive cells is depicted in the right upper corners. Human hematopoietic cells were detected in bone marrow cells of all first and second generation mice. The Figure depicts a representative experiment.

References

    1. Freireich EJ. Supportive care for patients with blood disorders. Br J Haematol. 2000;111:68–77. - PubMed
    1. Jendiroba DB, Freireich EJ. Granulocyte transfusions: from neutrophil replacement to immunereconstitution. Blood Rev. 2000;14:219–227. - PubMed
    1. Rebulla P. A mini-review on platelet refractoriness. Haematologica. 2005;90:247–253. - PubMed
    1. Sachs UJ. The pathogenesis of transfusion-related acute lung injury and how to avoid this serious adverse reaction of transfusion. Transfus Apher Sci. 2007;37:273–282. - PubMed
    1. Winters JL. Complications of donor apheresis. J Clin Apher. 2006;21:132–141. - PubMed

Publication types

MeSH terms