. 2011;6(6):e21419.
doi: 10.1371/journal.pone.0021419. Epub 2011 Jun 24.

Tumor initiating cells in esophageal squamous cell carcinomas express high levels of CD44

Affiliations

Tumor initiating cells in esophageal squamous cell carcinomas express high levels of CD44

Jiang-Sha Zhao et al. PLoS One. 2011.

Abstract

Background: Esophageal Squamous Cell Carcinoma (ESCC) is a major subtype of esophageal cancer causing significant morbility and mortality in Asia. Mechanism of initiation and progression of this disease is unclear. Tumor initiating cells (TICs) are the subpopulation of cells which have the ability to self-renew, as well as, to drive initiation and progression of cancer. Increasing evidence has shown that TICs exist in a variety of tumors. However, the identification and characterization of TICs in esophageal carcinoma has remained elusive.

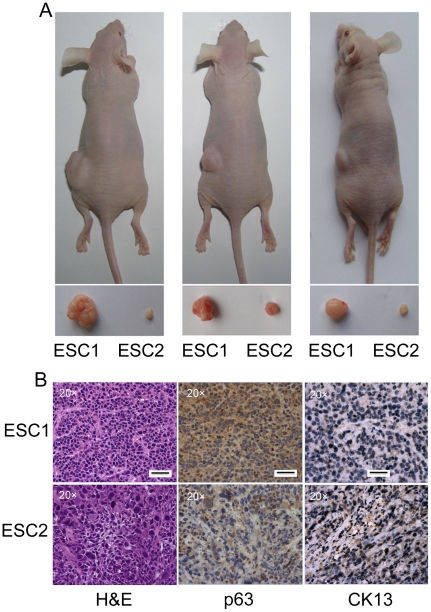
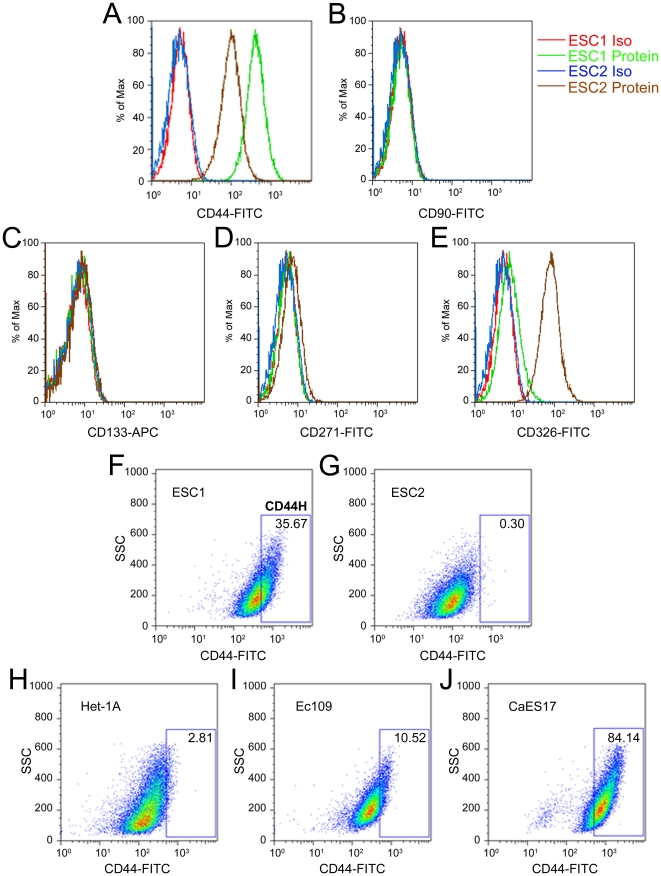
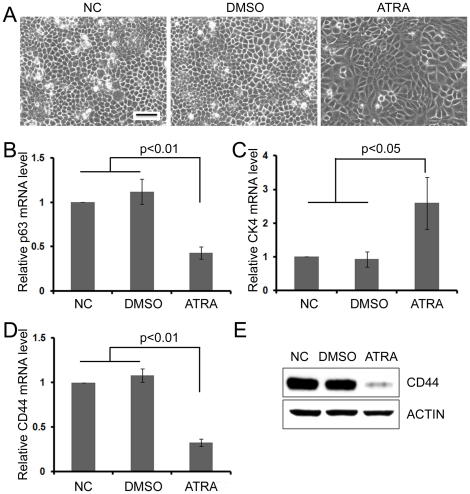
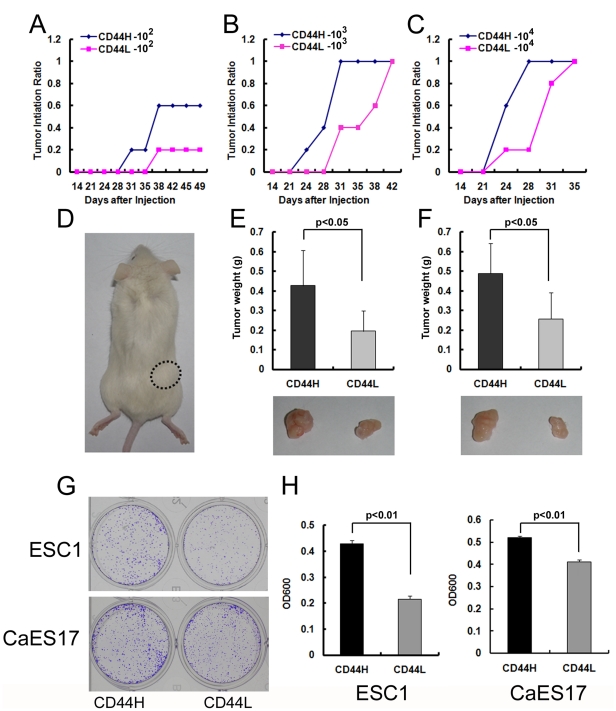
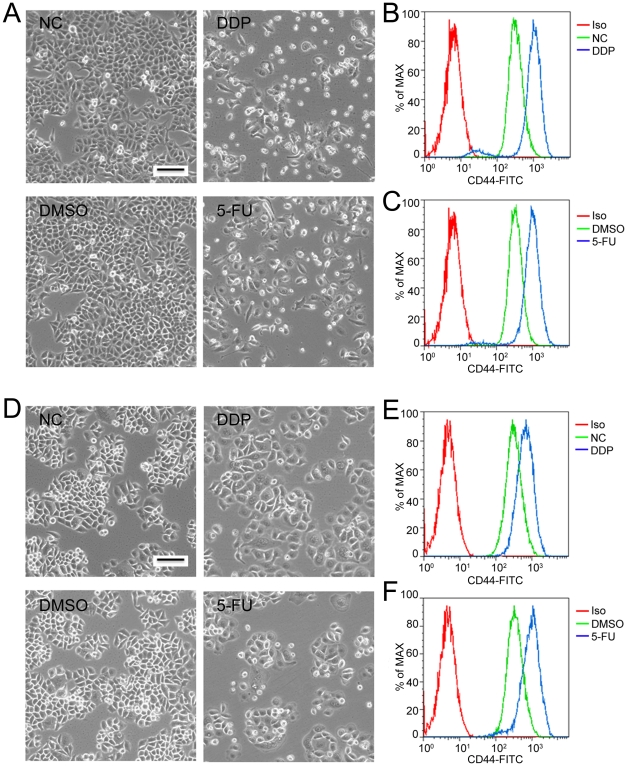
Methodology/principal findings: to identify TICs in ESCC, ESCC cell lines including two primary cells were used for screening suitable surface marker. Then colony formation assay, drug resistant assay and tumorigenicity assay in immune deficient mice were used to characterize TICs in ESCC. We found that just the CD44 expression correlated with tumorigenicity in ESCC cell lines. And then induced differentiation of ESCC cells by all-trans retinoic acid treatment led to decreased expression of CD44. The FACS isolated cell subpopulations with high CD44 expression showed increased colony formation and drug resistance in vitro, as well as significantly enhanced tumorigenicity in NOD/SICD mice, as compared to the low expressing CD44 ESCC cells.

Conclusions/significance: our study has discovered a novel TIC surface marker, CD44, which can be utilized to enrich efficiently the TICs in ESCC. These findings will be useful for further studies of these cells and exploring therapeutic approaches.


Conflict of interest statement

Competing Interests: The authors have declared that no competing interests exist.

Figures

Figure 1
Figure 1. ESC1 is more tumorigenic than ESC2 cells.
(A) 5×10⁵ of ESC1 or ESC2 cells were s.c. injected into nude mice. 3 weeks after cell injection, all mice were sacrificed; tumors were isolated and their weights were compared. (B) Tumors derived from both ESC1 and ESC2 were paraffin embedded. H&E staining was performed on these samples. Representative IHC analyses of p63 (a stemness marker), and CK13 (a differentiation marker) in ESC1 and ESC2 tumors. Scale bar: 50 micrometer.
Figure 2
Figure 2. Expression of cell surface protein on ESCC cells.
(A–E) measurement of the expression of CD44 (A), CD90 (B), CD133 (C), CD271 (D) and CD326 (E) in ESC1 and ESC2 cells by flow cytometry analysis. (F–J) Representative flow cytometry results examining the expression of CD44 in ESC1 (F), ESC2 (G), Het-1A (H), Ec109 (I) and CaES17 (J) cells. Using the comparative level of expression of CD44 in ESC1 versus Het-1A, we defined CD44 highly expressed subpopulation cells within the ESC1 line as CD44H (High) cells, and the remainder of the cell population as CD44L (Low) (F). ESC1 Iso (red line): ESC1 cells stained with isotype control antibody; ESC1 Protein (green line): ESC1 cells stained with candidate surface protein antibody; ESC2 Iso (blue line): ESC2 cells stained with isotype control antibody; ESC2 Protein (brown line): ESC2 cells stained with candidate surface protein antibody; FITC: fluorescein isothiocyanate; APC: allophycocyanin; SSC: side scatter.
Figure 3
Figure 3. Expression of CD44 in ESCC specimens.
(A) Representative IHC analyses of CD44 in normal esophageal tissues. (B) Magnification of (A) demonstrated that the expression of CD44 was in the basal layer (indicated by arrow). (C–F) Representative IHC analyses of CD44 in ESCC tissues. (C–D) showed specimens with strong expression of CD44 and (E–F) showed cases with weak expression of CD44. * indicated keratin pearl, a structure which represents terminal differentiation of the cancer cells; Letter “L”, cells exhibiting lower expression level of CD44 in (C–D); letter “H”, cells exhibiting higher expression of CD44 in (E–F). Scale bar: 50 micrometer.
Figure 4
Figure 4. Differentiation of ESC1 downregulated expression of CD44.
(A) Morphology of ESC1 cells treated with 20 µM ATRA for 5 days. (B–C) Real-time RT PCR of ATRA treated ESC1: p63 mRNA, an esophageal stemness marker (B); CK4, a differentiation marker (C). (D–E) Real-time RT PCR (D) and western blot (E) analysis of CD44 expression in ATRA-induced, differentiated ESC1 cells (20 µM, 5 days). Real-time RT PCR experiments were performed in triplicate and results were shown as mean ± SD. NC: blank control; DMSO: DMSO deluent treated cells; ATRA: ATRA treated cells; Scale bar: 50 micrometer.
Figure 5
Figure 5. CD44H subpopulation was more tumorigenic than CD44L cells.
(A–C) Tumorigenicity of 1×10² (A), 1×10³ (B) or 1×10⁴ (C) sorted CD44H and CD44L ESC1 cells in NOD/SCID mice. (D) Representative NOD/SCID mice with subcutaneous tumors from either CD44H (circle dash line) or CD44L (no tumor formed) ESC1 cells at the dosage of 1×10². (E–F) Average tumor weight of CD44H tumors and CD44L tumors at the dosage of either 1×10³ (E upper panel) or 1×10⁴ (F upper panel). Representative subcutaneous tumors derived from CD44H or CD44L ESC1 cells at the dosage of either 1×10³ (E lower panel) or 1×10⁴ (F lower panel). Data are generated from 5 mice in each group. (G) Representative photographs of the plates containing colonies derived from either 2000 CD44H or CD44L ESC1 or CaES17 cells. (H) Quantification of (G) by Crystal Violet staining. Colony formation experiments were performed in triplicate (mean ± SD).
Figure 6
Figure 6. Chemotherapeutic drugs induced cell death in ESC1 and Ec109 cells and enriched for a CD44H population of cells.
(A) Morphology of ESC1 cells treated with either 12.5 µg/ml DDP (cis-Diammineplatinum(II) dichloride, right upper panel) or 1.25 µg/ml 5-FU (5-Fluorouracil, right lower panel) for 2 days. (B–C) Representative flow cytometry analyses of CD44 expression in ESC1 cells after either DDP (B) or 5-FU (C) treatment. (D) Morphology of Ec109 cells treated with either 50 µg/ml DDP (right upper panel) or 2 µg/ml 5-FU (right lower panel) for 2 days. (E–F) Representative flow cytometry analyses of CD44 expression in Ec109 cells after either DDP (E) or 5-FU (F) treatment. Iso: isotype control; NC: blank control; DMSO: DMSO diluents treated cells; DDP: DDP treated cells; 5-FU: 5-FU treated cells; Scale bar: 50 micrometer.

References

    1. Vizcaino AP, Moreno V, Lambert R, Parkin DM. Time trends incidence of both major histologic types of esophageal carcinomas in selected countries, 1973–1995. Int J Cancer. 2002;99:860–868. - PubMed
    1. Ke L. Mortality and incidence trends from esophagus cancer in selected geographic areas of China circa 1970–90. Int J Cancer. 2002;102:271–274. - PubMed
    1. Jemal A, Siegel R, Xu J, Ward E. Cancer statistics, 2010. CA Cancer J Clin. 2010;60:277–300. - PubMed
    1. Enzinger PC, Mayer RJ. Esophageal cancer. N Engl J Med. 2003;349:2241–2252. - PubMed
    1. Frank NY, Schatton T, Frank MH. The therapeutic promise of the cancer stem cell concept. J Clin Invest. 2010;120:41–50. - PMC - PubMed

Publication types

MeSH terms