. 2011 Sep;54(9):2347-57.
doi: 10.1007/s00125-011-2221-6. Epub 2011 Jul 6.

Deletion of Ia-2 and/or Ia-2β in mice decreases insulin secretion by reducing the number of dense core vesicles

Affiliations

Deletion of Ia-2 and/or Ia-2β in mice decreases insulin secretion by reducing the number of dense core vesicles

T Cai et al. Diabetologia. 2011 Sep.

Abstract

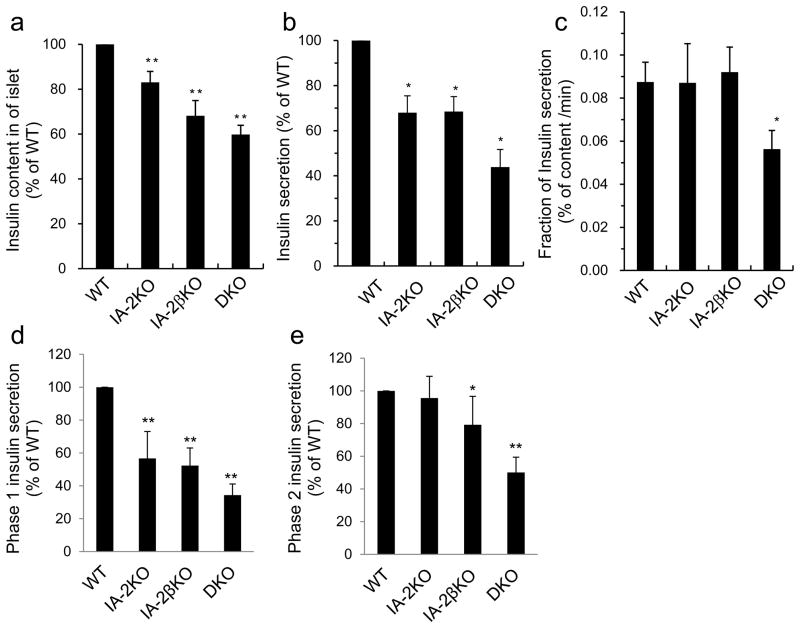
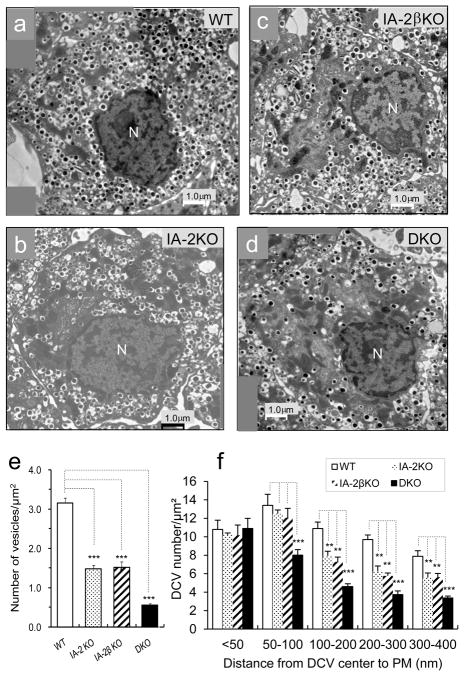
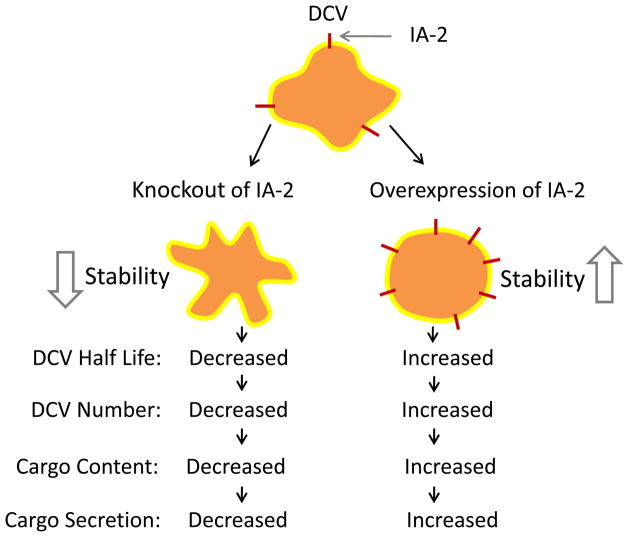
Aims/hypothesis: Islet antigen 2 (IA-2) and IA-2β are dense core vesicle (DCV) transmembrane proteins and major autoantigens in type 1 diabetes. The present experiments were initiated to test the hypothesis that the knockout of the genes encoding these proteins impairs the secretion of insulin by reducing the number of DCV.

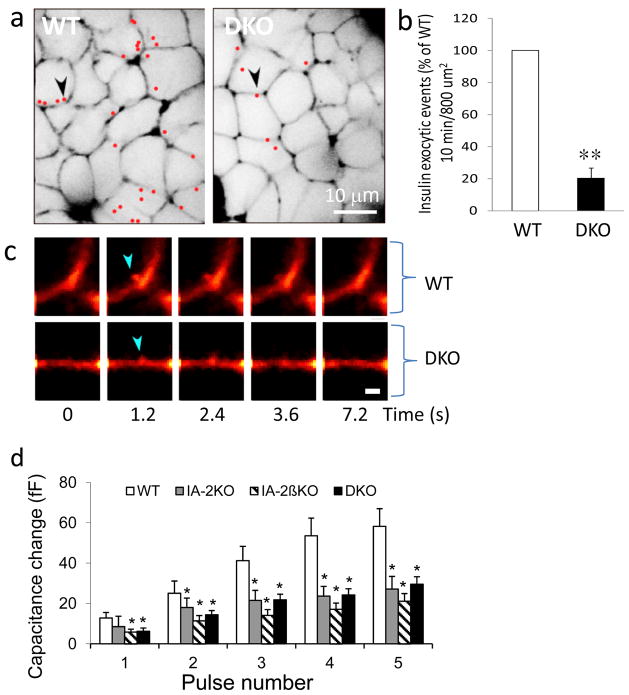
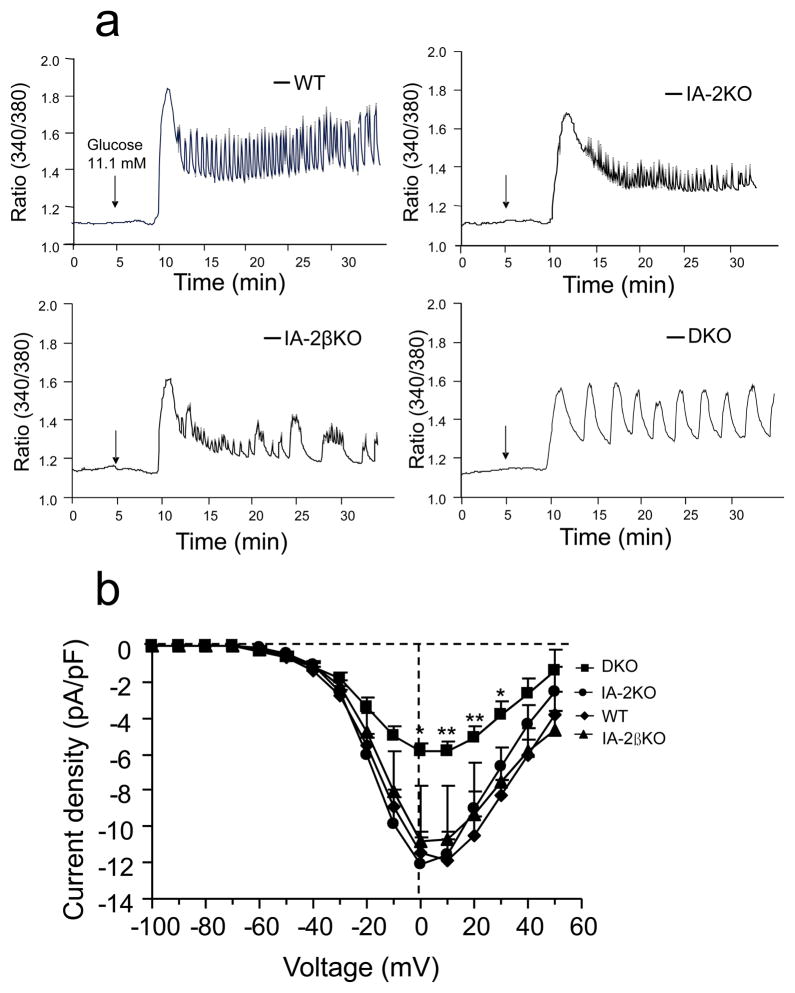
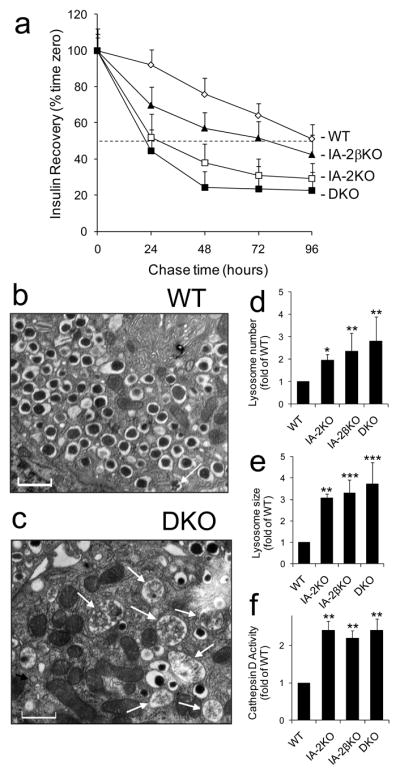
Methods: Insulin secretion, content and DCV number were evaluated in islets from single knockout (Ia-2 [also known as Ptprn] KO, Ia-2β [also known as Ptprn2] KO) and double knockout (DKO) mice by a variety of techniques including electron and two-photon microscopy, membrane capacitance, Ca(2+) currents, DCV half-life, lysosome number and size and autophagy.

Results: Islets from single and DKO mice all showed a significant decrease in insulin content, insulin secretion and the number and half-life of DCV (p < 0.05 to 0.001). Exocytosis as evaluated by two-photon microscopy, membrane capacitance and Ca(2+) currents supports these findings. Electron microscopy of islets from KO mice revealed a marked increase (p < 0.05 to 0.001) in the number and size of lysosomes and enzymatic studies showed an increase in cathepsin D activity (p < 0.01). LC3 protein, an indicator of autophagy, also was increased in islets of KO compared with wild-type mice (p < 0.05 to 0.01) suggesting that autophagy might be involved in the deletion of DCV.

Conclusions/interpretation: We conclude that the decrease in insulin content and secretion, resulting from the deletion of Ia-2 and/or Ia-2β, is due to a decrease in the number of DCV.


Conflict of interest statement

No potential conflicts of interest relevant to this article were reported.

Figures

Fig. 1
Fig. 1
Insulin content and glucose-stimulated insulin secretion in KO mice. (a) Insulin content in islets of KO mice as compared to WT mice. (b) Glucose-stimulated insulin secretion determined 60 minutes after raising the glucose level from 1.0 mmol/l to 16.7 mmol/l. (c) Fractional secretion of insulin (amount secreted divided by the total amount present). Glucose-stimulated insulin secretion in Phase I (d) as compared to (e) Phase II. (*) p < 0.05; (**) p < 0.01. Data bars (mean ± SE) represent the average of 5 independent experiments, each genotype consisting of 25 islets performed in triplicate.
Fig. 2
Fig. 2
Number of DCV in WT and KO mice. Representative electron micrographs showing DCV in β cells of (a) WT, (b) IA-2KO, (c) IA-2βKO and (d) DKO mice. (e) Analysis of DCV from 26 β cells from each of the four genotypes (three mice per genotype). (f) Relative density of DCVs located in 50 or 100 nm concentric shells in the first 400 nm below the plasma membrane (PM) was plotted (n =26 β cells in each group). In the readily releasable pool (<200 nm), the average densities of DCVs (number/μm2 ± SE) in IA-2KO (9.67 ± 0.77), IA-2βKO (9.24 ± 0.64) and DKO β cells (7.07 ± 0.44) are significantly lower than that in WT (11.51 ± 0.64) (p < 0.05, p < 0.05, and p < 0.0001, respectively). Each electron micrograph was quantitated by three individuals and analyzed by NIH ImageJ software. (**) p < 0.01; (***) p < 0.001 (mean ± SE).
Fig. 3
Fig. 3
Glucose-stimulated DCV exocytosis in islets evaluated by two photon microscopy. (a) Spatial distribution of exocytotic sites in the islet cells: Left, WT, right, DKO. Scale bar, 10 microm. (b) Quantitation of insulin exocytotic events. (**) p < 0.01. (c) Single exocytic events visualized with polar fluorescent tracer, the red fluorescence dye sulforhodamine B (SRB). Transient red spots disappear at the moment of exocytosis and represent secretion of insulin. Scale bar, 1 microm. (d) Mean increases in capacitance elicited by membrane depolarization were significantly less in KO than WT mice. (*) p < 0.05. The capacitances for each group tested were determined using 5–16 β cells. Error bars show standard error of the mean.
Fig. 4
Fig. 4
Changes in glucose-dependent islet [Ca2+]i oscillations and voltage-dependent Ca2+ currents in WT and KO. (a) The first peak in [Ca2+]i seen upon raising glucose from 2.8 to 11.1 mmol/l was higher, and the steady-state frequency as well as the regularity of the [Ca2+]i oscillations were greater in WT vs. KO mice. (b) Under voltage-clamp conditions, there was also a substantial decrease in the voltage-dependent Ca2+ currents of β-cells from DKO as compared with β-cells from SKO or WT mice. Ca2+ currents were evoked using 40 msec clamp commands from -100 to +60 mV from a holding potential of −65 mV (see Methods). The number of β cells used for the whole-cell calcium measurements were 10, 6, 6, and 13 for WT, IA-2KO, IA-2βKO, and DKO respectively. Error bars show standard error of the mean.
Fig. 5
Fig. 5
Half-life of DCV. (a) Islets were pulsed with [35S]-methionine and [35S]-cysteine and chased for 96 hours. Labeled insulin was pulled down with anti-insulin antibody and the half-life of insulin in the WT and KO islets was determined. WT vs DKO mice. (**) p < 0.01. (b, c) Lysosomes in β cells of mice. Representative electron micrographs showing a substantial increase in the number and size of lysosomes (white arrows) in the β cells of the DKO as compared to the WT mice. Scale bar, 100 mm. (d) Lysosome number; (e) Lysosome size; and (f) Cathepsin D activity in the islets. (*) p < 0.05, (**) p < 0.01, (***) p < 0.001.
Fig. 6
Fig. 6
Representative elecron micrographs of β cells showing (a) fusion and (b) uptake of DCV by lysosomes and (c) by multigranular bodies in IA-2KO, IA-2βKO and DKO mice, respectively. Cultured islet cells from WT and KO mice (d-g) transfected with adenovirus- LC3::GFP showing an increase in the conjugation of LC3::GFP to autophagic membranes of the KO as compared to the WT mice. (h) quantitative analysis of LC3-GFP in each of the genotypes. (*) p < 0.05; (**) p < 0.01.
Fig. 7
Fig. 7
Effect of IA-2 on the stability of DCV. In mice, the KO of IA-2 destabilizes and decreases the half-life of DCV. In turn, the number of DCV, the amount of insulin in β cells and its secretion, is decreased. In MIN6 cells, overexpression of IA-2 adds stability to and increases the half-life of DCV. In turn, the number of DCV, the amount of insulin in β cells and its secretion is increased. Supplemental Methods

Similar articles

Cited by

References

    1. Lan MS, Lu J, Goto Y, Notkins AL. Molecular cloning and identification of a receptor-type protein tyrosine phosphatase, IA-2, from human insulinoma. DNA Cell Biol. 1994;13:505–514. - PubMed
    1. Lu J, Li Q, Xie H, et al. Identification of a second transmembrane protein tyrosine phosphatase, IA-2beta, as an autoantigen in insulin-dependent diabetes mellitus: precursor of the 37-kDa tryptic fragment. Proc Natl Acad Sci U S A. 1996;93:2307–2311. - PMC - PubMed
    1. Notkins AL, Lernmark A. Autoimmune type 1 diabetes: resolved and unresolved issues. J Clin Invest. 2001;108:1247–1252. - PMC - PubMed
    1. Verge CF, Gianani R, Kawasaki E, et al. Prediction of type I diabetes in first-degree relatives using a combination of insulin, GAD, and ICA512bdc/IA-2 autoantibodies. Diabetes. 1996;45:926–933. - PubMed
    1. Bingley PJ, Bonifacio E, Gale EA. Can we really predict IDDM? Diabetes. 1993;42:213–220. - PubMed

Publication types

MeSH terms