. 2012 May;227(5):1960-71.
doi: 10.1002/jcp.22924.

Rspo2/Int7 regulates invasiveness and tumorigenic properties of mammary epithelial cells

Affiliations

Rspo2/Int7 regulates invasiveness and tumorigenic properties of mammary epithelial cells

Malgorzata Klauzinska et al. J Cell Physiol. 2012 May.

Abstract

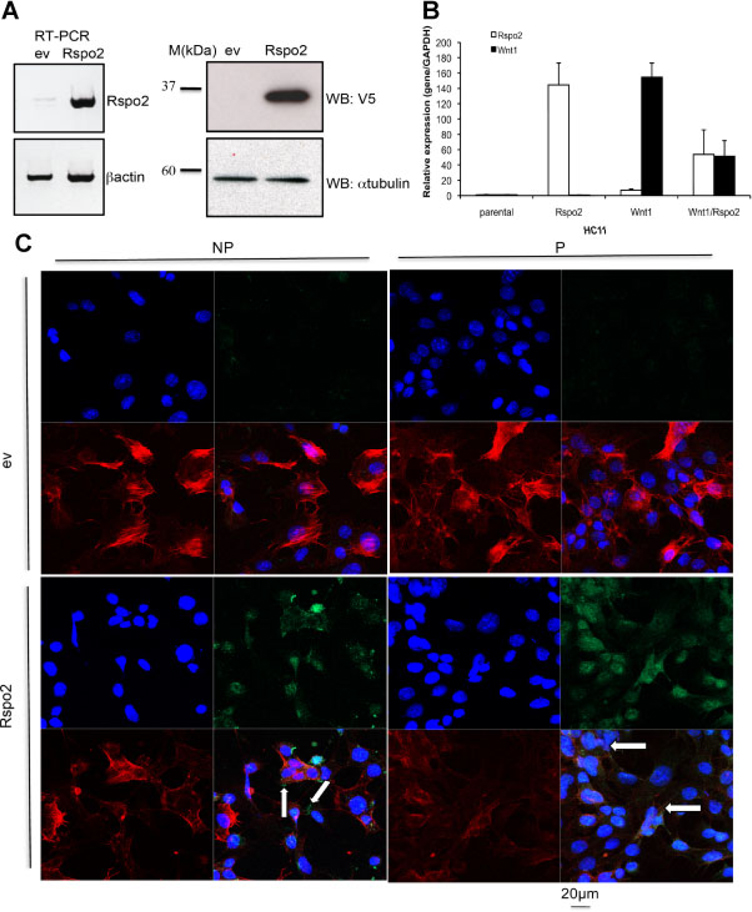
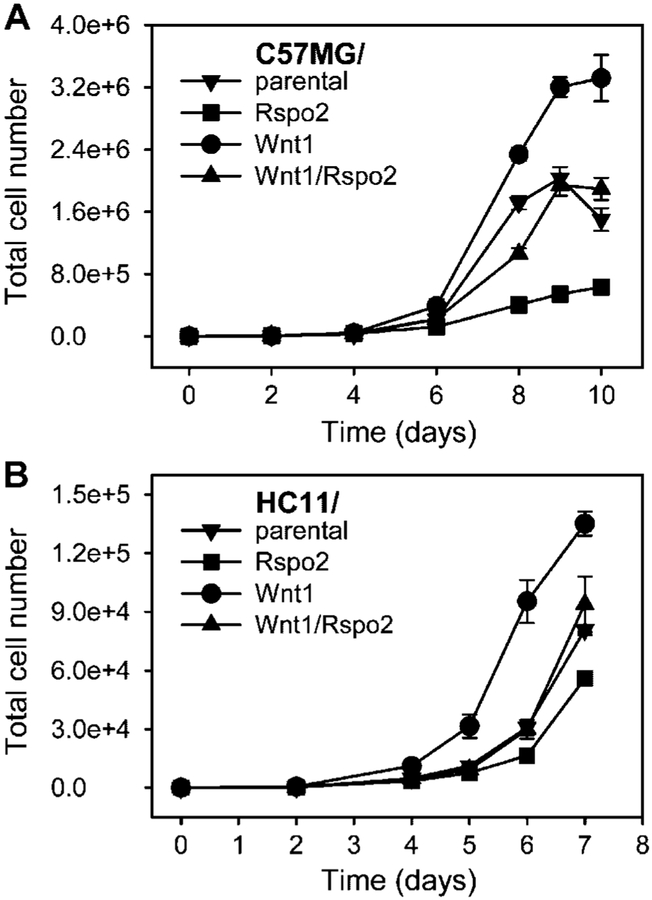
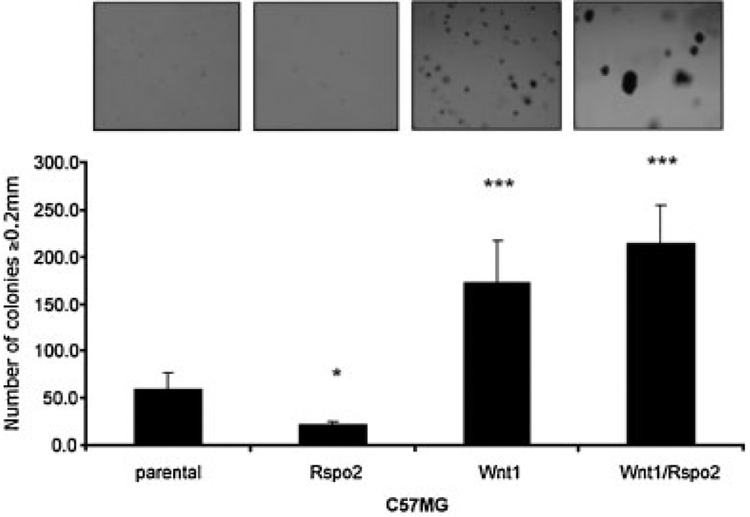
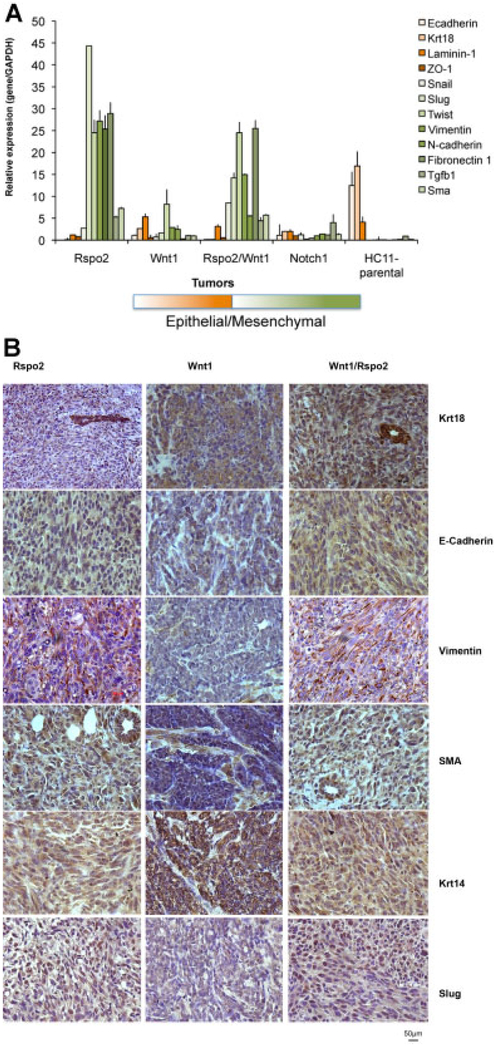
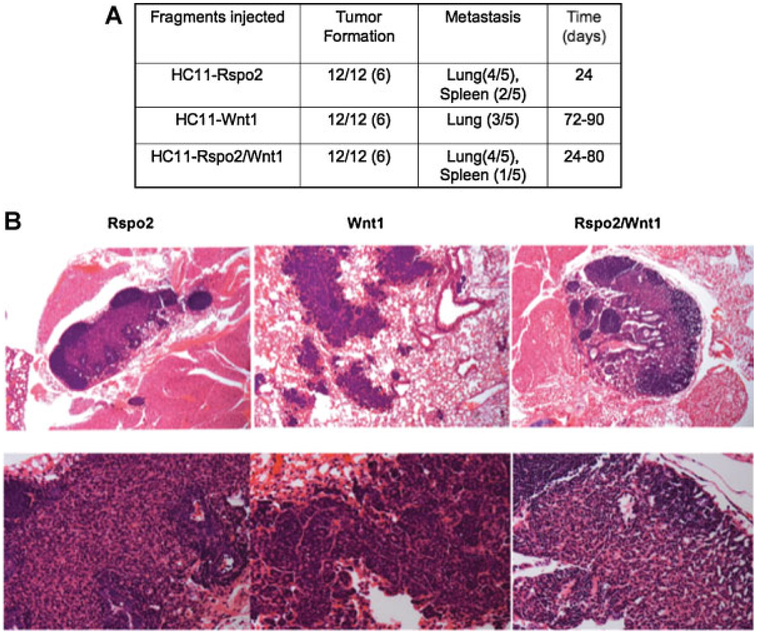
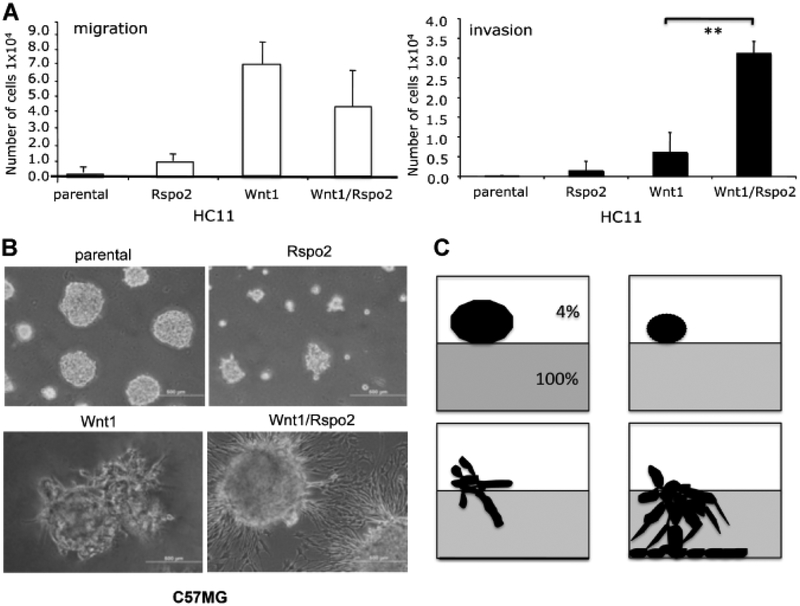
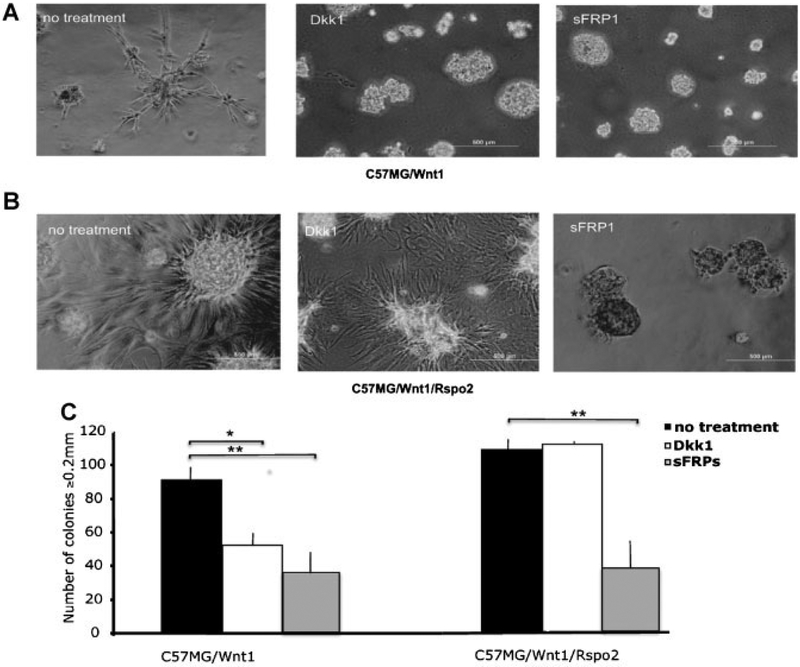
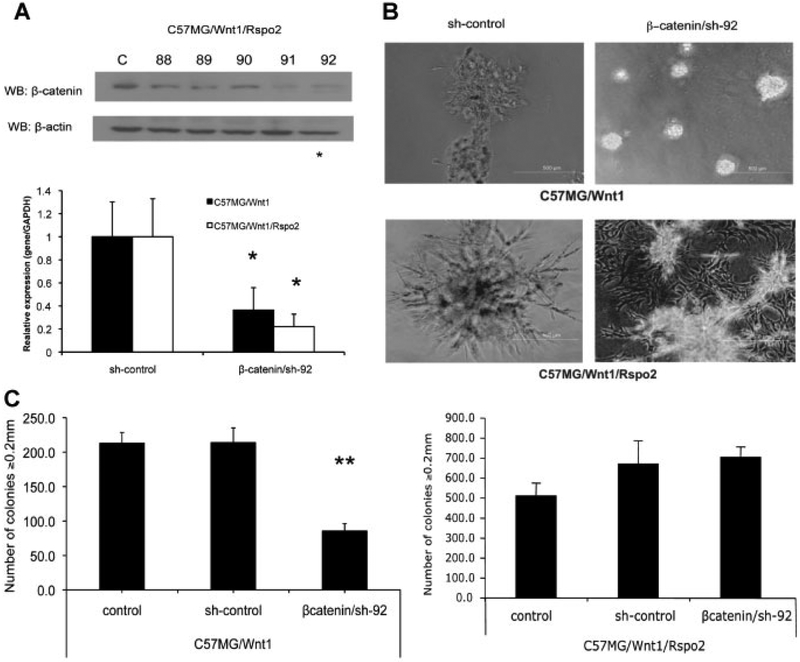
Rspo2 was identified as a novel common integration site (CIS) for the mouse mammary tumor virus (MMTV) in viral induced mouse mammary tumors. Here we show that Rspo2 modulates Wnt signaling in mouse mammary epithelial cells. Co-expression of both genes resulted in an intermediate growth phenotype on plastic and had minor effects on the growth-promoting properties of Wnt1 in soft agar. However, individual Rspo2 and Wnt1 HC11 transfectants as well as the double transfectant were tumorigenic in athymic nude mice, with tumors from each line having distinctive histological characteristics. Rspo2 and Rspo2/Wnt1 tumors contained many spindle cells, consistent with an epithelial-mesenchymal transformation (EMT) phenotype. When Rspo2 and Rspo2/Wnt1 tumor cells were transferred into naïve mice, they exhibited greater metastatic activity than cells derived from Wnt1 tumors. For comparison, C57MG/Wnt1/Rspo2 co-transfectants exhibited invasive properties in three-dimensional (3D) Matrigel cultures that were not seen with cells transfected only with Wnt1 or Rspo2. Use of Dickkopf-1, a specific antagonist of the Wnt/β-catenin pathway, or short hairpin RNA targeting β-catenin expression demonstrated that the invasive activity was not mediated by β-catenin. Our results indicate that Rspo2 and Wnt1 have mutually distinct effects on mammary epithelial cell growth and these effects are context-dependent. While Rspo2 and Wnt1 act synergistically in the β-catenin pathway, other mechanisms are responsible for the invasive properties of stable double transfectants observed in 3D Matrigel cultures.


Figures

Fig. 1.
Fig. 1.
Rspo2 expression in mouse mammary epithelial cell lines C57MG and HC11. A: Stable expression of Rspo2 in the C57MG mammary epithelial cell line was confirmed by RT-PCR and immunoblotting with anti-V5. β-Actin was an internal control for RT-PCR and anti-α-tubulin blotting was used as a loading control for Western analysis. B: Relative expression of transgenic Rspo2 and Wnt1 in stable lines of HC11 cells. C: Localization of Rspo2 expressed in mouse mammary epithelial cells. HC11 cells stably transfected with an empty vector (ev) or the full-length Rspo2 cDNA construct were fixed and stained under non-permeabilized (NP) or permeabilized (P) conditions to visualize Rspo2 protein localization. Rspo2 proteins were detected with V5 antibody (green, upper and lower right parts), while cell boundaries were indicated by phalloidin (red, lower right and left parts) staining of polymerized actin and DAPI (blue, upper left and lower right parts) stained nuclei.
Fig. 2.
Fig. 2.
Rspo2 and Wnt1 over-expression have contrasting effects on cell growth in monolayer culture. Growth curves of parental cell lines and stable transfectants expressing either Rspo2 or Wnt1 alone or in combination were generated as described in the Materials and Methods Section (upper part C57MG, lower part HC11). Cells were seeded in 24-well plates (1,000 cells/well), and were trypsinized and counted at 24 or 48 h intervals. Each counting was done in triplicate and expressed as the mean ± SD.
Fig. 3.
Fig. 3.
Growth of Rspo2 and Wnt1 expressing cells in soft agar. Cells from the indicated C57MG lines were placed in 6-well plates in 0.3% soft agar (15,000 cells/well). After 21 days they were visualized by overnight staining with nitrobluetetrazolium and counted for size ≥0.2 mm. Results are from a representative assay performed in triplicate and expressed as the mean ± SD. *P < 0.05, ***P < 0.01 compared to parental line (t-test).
Fig. 4.
Fig. 4.
Cells expressing Rspo2 and Wnt1 individually and together are capable of tumor growth in nude mice. A: Pools of two million cells each of HC11/parental, HC11/ev, HC11/Rspo2, HC11/Wnt1, or HC11/Wnt1/Rspo2 were injected in the left and right #4 inguinal mammary gland of female nude mice. Before injection cells were placed in 12.5% Growth Factor Reduced Matrigel suspension to simulate the tumor microenvironment. Tumor growth curves represent the mean tumor size ± SD, determined weekly in two dimensions. HC11 cells did not yield tumors. B: H&E staining of representative tumors. Rspo2 cells gave rise to tumors with swirls of spindle-shaped neoplastic cells. Wnt1 tumors showed cells arranged in several types of structure within the same tumor section (Wnt1 a): Nests with microglandular features (black circle), cord-like organization (red box), spindle-shaped cells arranged in a dense fibrous pattern (green oval) as well as areas of squamous-like metaplasia (black arrows). Higher magnifications showed tumor cells arranged in glandular-like fashion compatible with an adenocarcinoma (Wnt1 b). Wnt1/Rspo2 tumor mass contained cells variable in size and shape that formed swirls containing large spindle-shaped cells. Other areas within the tumor had a more solid and undifferentiated organization characterized by cells with high-grade nuclear pleomorphism. Occasional mitotic figures can be seen (short arrows) (lower part a Wnt1/Rspo2). The original magnification was 100× (a) and 400× (b).
Fig. 5.
Fig. 5.
Rspo2 derived tumors show EMT signature. A: Relative expression of the mRNAs encoding EMT-related genes: E-cadherin, Cytokeratin 18 (Krt18), Laminin-1, ZO-1, Snail, Slug, Twist, Vimentin, N-cadherin, Fibronectin1, TGFb1, and SMA in Rspo2, Wnt1, Rspo2/Wnt1, and Notch1 tumors as well as in cultured parental HC11 cells, determined by real-time PCR. GAPDH mRNA was used to normalize the variability in template loading. The data are reported as the means ± SD from one representative tumor from each group analyzed in three repeats. B: Immunohistochemical staining of Rspo2, Wnt1, and Rspo2/Wnt1 tumors for Cytokeratin 18 (Krt18), E-cadherin, Vimentin, Cytokeratin 14 (Krt14), SMA, and Slug. The original magnification was 400×.
Fig. 6.
Fig. 6.
Metastasis of Rspo2, Wnt1, and Rspo2/Wnt1 derived tumors to the lungs and/or spleen. A: Fragments of Rspo2, Wnt1, and Rspo2/Wnt1 tumors were implanted in the left and right#4 inguinal mammary gland of six female athymic nude mice. Tumors reaching size of 300–350 mg were removed in survival surgery and mice were subsequently monitored for evidence of metastases. The numbers in parenthesis reflect the number of mice with mammary tumors or lung/spleen metastasis. B: H&E staining of representative lung metastases. Rspo2 expressing cells gave rise to tumors with swirls of spindle-shaped neoplastic cells. Occasionally areas of densely packed more epithelial-like cells were found. Original magnification 100× upper row, 400× lower row.
Fig. 7.
Fig. 7.
Rspo2 and Wnt1 activity in migration and invasion assays. A: 3D Matrigel cultures of parental C57MG cells and cells expressing Rspo2 and Wnt1 alone or together. Wells were covered with 100% Matrigel. Cells were plated in 4% Growth Factors Reduced Matrigel at 3,500 cells/well. Colony formation and Matrigel penetration was determined after 5 days. The original magnification was 100×. The focus was set to detect cells that entered the layer of 100%Matrigel. B: Schematic representation of growth pattern observed in 3D Matrigel culture, corresponding to images in (A). C: Transwell migration and invasion assays of parental HC11 cells and transfectants. HC11 cell pools (2.5 × 10⁵/well) were placed in a transwell migration (upper part) or invasion chamber (lower part), with10%FBS in the lower chamber. The number of cells crossing through the pores in the migration assay was determined at 24 h. The number of cells invading through Matrigel-occluded pores was determined at 48 h. The number of migrating or invading cells is expressed as mean ± SD. **P < 0.02 (t-test). Scale bar = 500 μm.
Fig. 8.
Fig. 8.
Differential effects of Dkk1 and sFRP1 on C57MG/Wnt1 and C57MG/Wnt1/Rspo2 cells in Matrigel and soft agar assays. C57MG/Wnt1 (A) and C57MG/Wnt1/Rspo2 (B) cells were plated on Matrigel or in soft agar (C) in the presence of growth medium alone (no treatment) or in medium containing 1 μg/ml Dkk1 or 10 μg/ml sFRP1. Fresh inhibitors were applied every 48 h for 5 days in the Matrigel assay or 21days in the soft agar assay. The original magnification was 100×. Experiments were performed in triplicate and results indicate the mean ± SD of a representative experiment. *P < 0.05 (t-test). Scale bar = 500 μm.
Fig. 9.
Fig. 9.
Differential effects of β-catenin shRNA on C57MG/Wnt1 and C57MG/Wnt1/Rspo2 cells in Matrigel and soft agar assays. A: Silencing of β-catenin expression in C57MG/Wnt1 and C57MG/Wnt1/Rspo2 cells by shRNA lentiviral technology was confirmed by WB (sh-control and 5 b-catenin targets) and real time RT-PCR (β-catenin/sh-92 vs. sh-control). Vector carrying nonsense, non-targeting shRNA was used to define baseline expression (sh-control). B: Representative Matrigel penetration assay for C57MG/Wnt1 and C57MG/Wnt1/Rspo2 cells following β-catenin knockdown (β-catenin/sh-92). Cells were plated in 4% Growth Factors Reduced Matrigel at 3,500 cells/well. Matrigel penetration was determined after 5 days. The original magnification was 100×.Scale bar = 500 μm. C: Colony formation assay for C57MG/Wnt1andC57MG/Wnt1/Rspo2 cells after β-catenin knockdown (β-catenin/sh-92). Cells were placed in 6-well plates in 0.3% soft agar at 15,000 cells/well. After 21 days they were visualized by overnight staining with nitrobluetetrazolium and counted for size ≥0.2 mm. Experiments were performed in triplicate and results indicate the mean ± SD of a representative experiment. **P < 0.02 (t-test).

References

    1. Bafico A, Gazit A, Wu-Morgan SS, Yaniv A, Aaronson SA. 1998. Characterization of Wnt-1 and Wnt-2 induced growth alterations and signaling pathways in NIH3T3 fibroblasts. Oncogene 16:2819–2825. - PubMed
    1. Ball RK, Friis RR, Schoenenberger CA, Doppler W, Groner B. 1988. Prolactin regulation of beta-casein gene expression and of a cytosolic 120-kd protein in a cloned mouse mammary epithelial cell line. EMBO J 7:2089–2095. - PMC - PubMed
    1. Bejsovec A 2005. Wnt pathway activation: New relations and locations. Cell 120:11–14. - PubMed
    1. Binnerts ME, Kim KA, Bright JM, Patel SM, Tran K, Zhou M, Leung JM, Liu Y, Lomas WE III, Dixon M, Hazell SA, Wagle M, Nie WS, Tomasevic N, Williams J, Zhan X, Levy MD, Funk WD, Abo A. 2007. R-Spondin1 regulates Wnt signaling by inhibiting internalization of LRP6. Proc Natl Acad Sci USA 104:14700–14705. - PMC - PubMed
    1. Cadigan KM, Liu YI. 2006. Wnt signaling: Complexity at the surface. J Cell Sci 119:395–402. - PubMed

Publication types

MeSH terms

LinkOut - more resources