. 2011 Feb;29(2):217-28.
doi: 10.1002/stem.576.

An endothelial cell niche induces hepatic specification through dual repression of Wnt and Notch signaling

Affiliations

An endothelial cell niche induces hepatic specification through dual repression of Wnt and Notch signaling

Songyan Han et al. Stem Cells. 2011 Feb.

Abstract

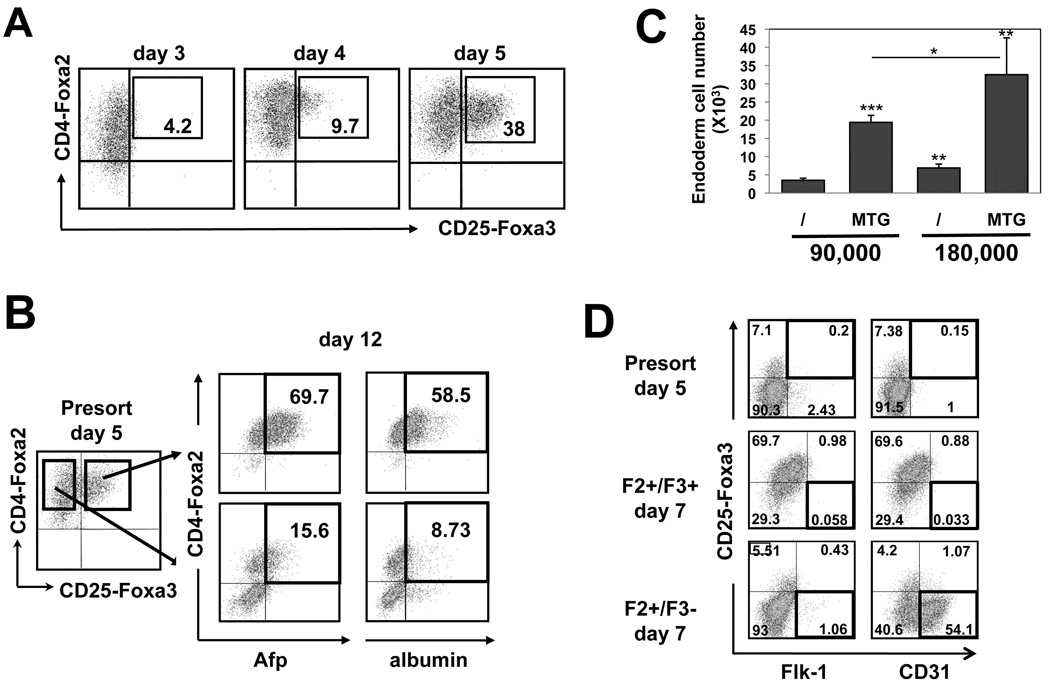
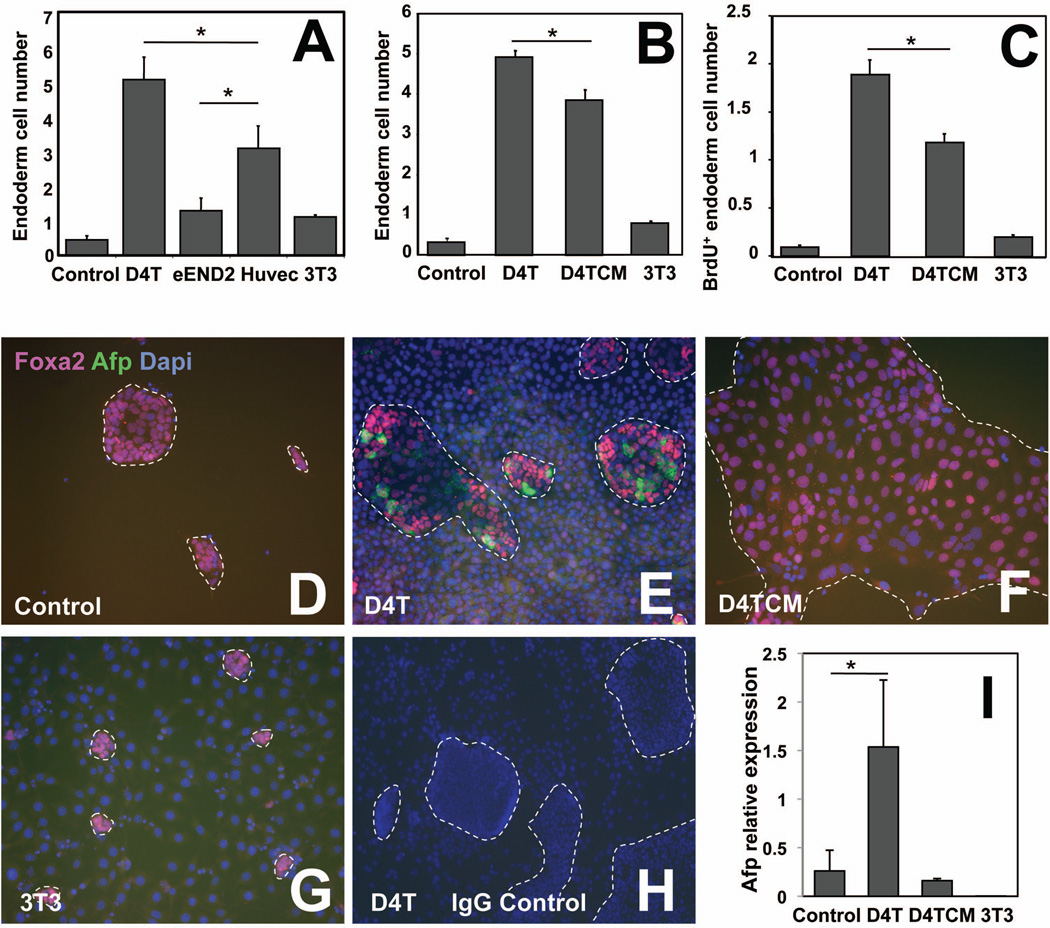
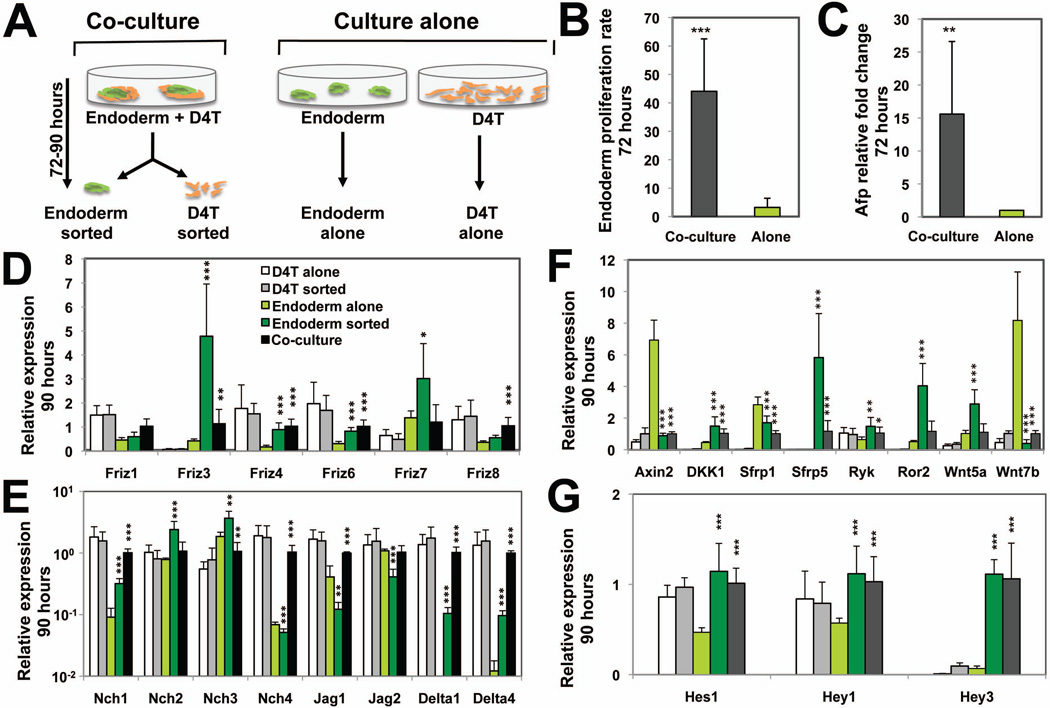
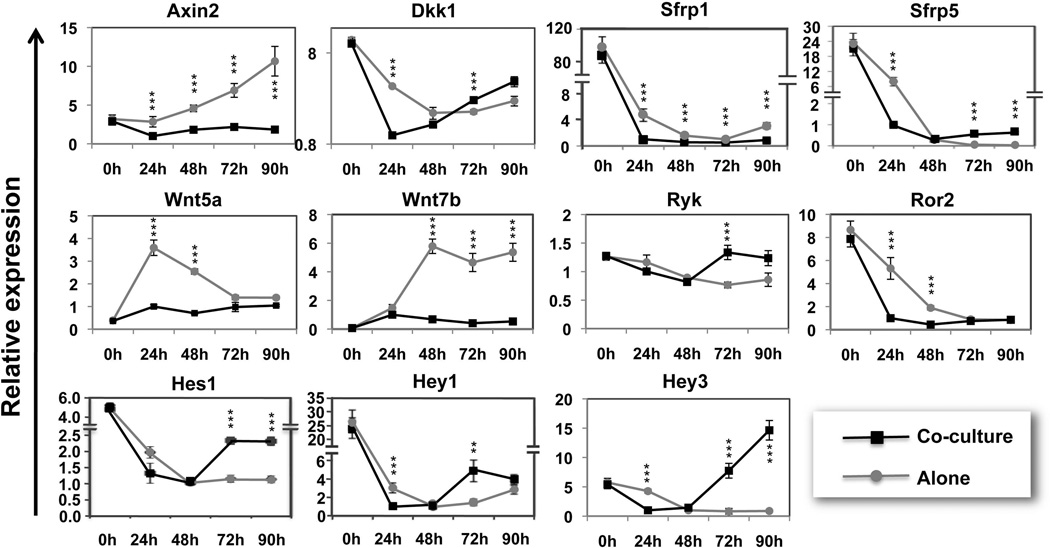
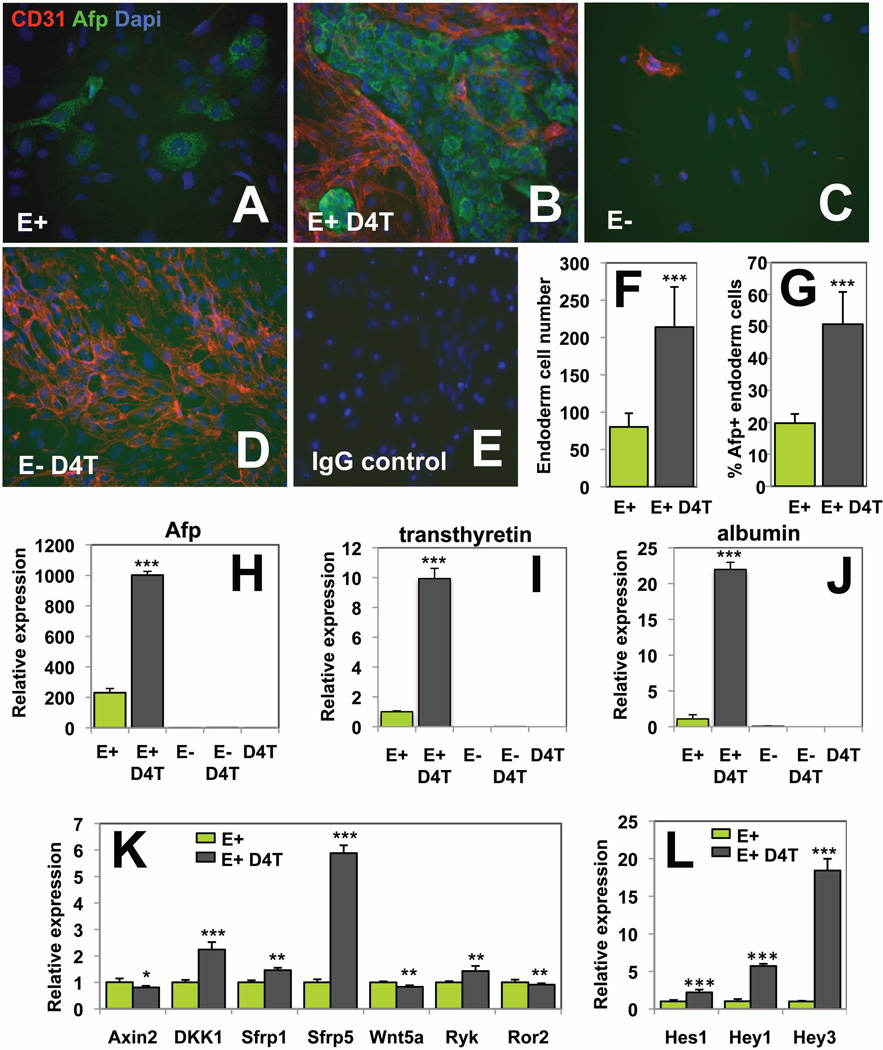
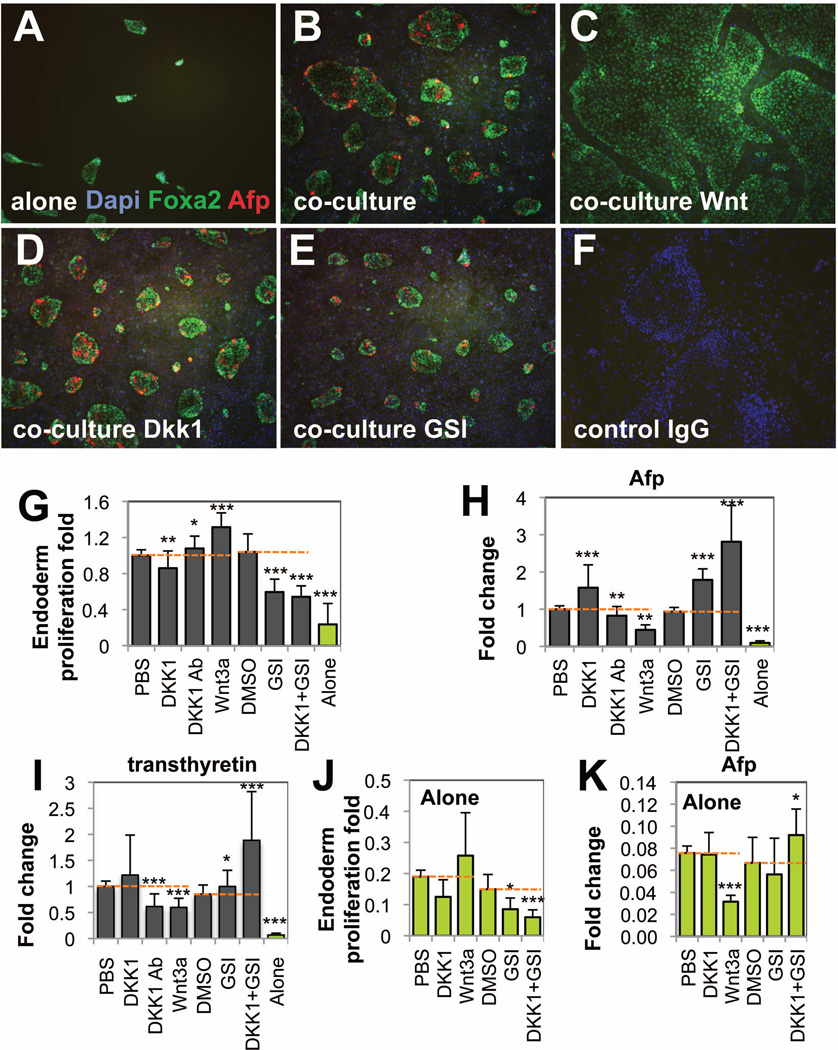
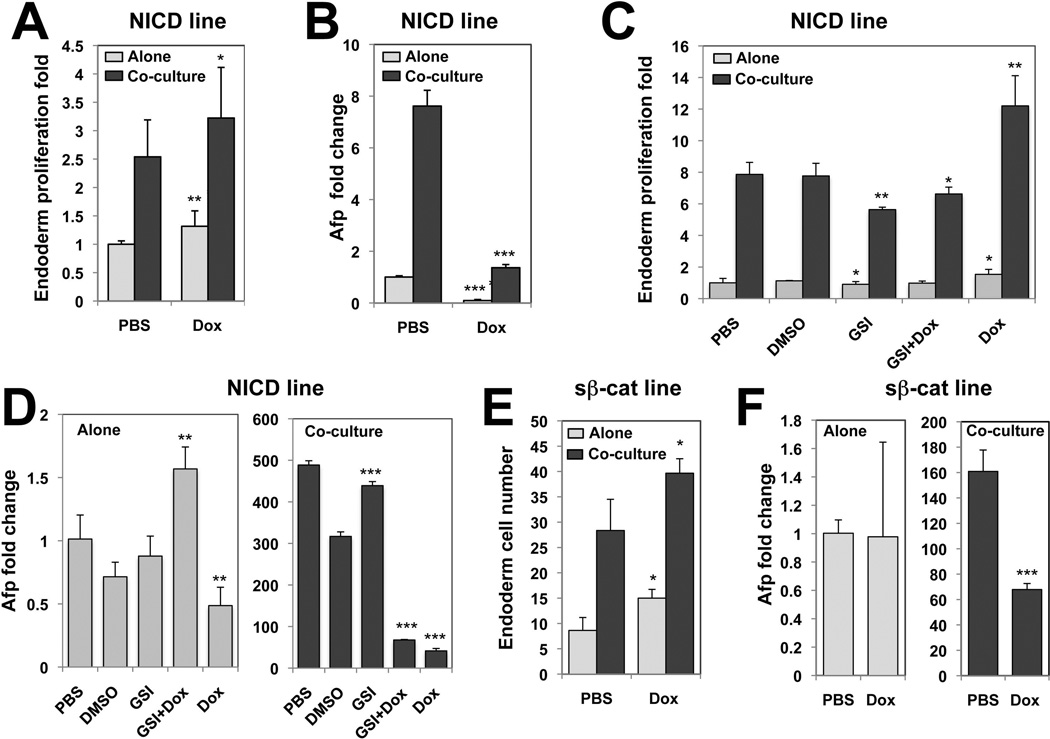
Complex cross-talk between endoderm and the microenvironment is an absolute requirement to orchestrate hepatic specification and expansion. In the mouse, the septum transversum and cardiac mesoderm, through secreted bone morphogenetic proteins (BMP) and fibroblast growth factors (FGF), respectively, instruct the adjacent ventral endoderm to become hepatic endoderm. Consecutively, endothelial cells promote expansion of the specified hepatic endoderm. By using a mouse reporter embryonic stem cell line, in which hCD4 and hCD25 were targeted to the Foxa2 and Foxa3 loci, we reconstituted an in vitro culture system in which committed endoderm cells coexpressing hCD4-Foxa2 and hCD25-Foxa3 were isolated and cocultured with endothelial cells in the presence of BMP4 and bFGF. In this culture setting, we provide mechanistic evidence that endothelial cells function not only to promote hepatic endoderm expansion but are also required at an earlier step for hepatic specification, at least in part through regulation of the Wnt and Notch pathways. Activation of Wnt and Notch by chemical or genetic approaches increases endoderm cell numbers but inhibits hepatic specification, and conversely, chemical inhibition of both pathways enhances hepatic specification and reduces proliferation. By using identical coculture conditions, we defined a similar dependence of endoderm harvested from embryos on endothelial cells to support their growth and hepatic specification. Our findings (1) confirm a conserved role of Wnt repression for mouse hepatic specification, (2) uncover a novel role for Notch repression in the hepatic fate decision, and (3) demonstrate that repression of Wnt and Notch signaling in hepatic endoderm is controlled by the endothelial cell niche.


Conflict of interest statement

DISCLOSURE OF POTENTIAL CONFLICTS OF INTEREST

The authors indicate no potential conflict of interest.

Figures

Fig. 1
Fig. 1. Hepatic specification of the day5 endoderm F2+/F3+ population devoid of endothelial potential
(A) Kinetics of CD4-Foxa2 and CD25-Foxa3 expression between day3 and day5 of differentiation following Activin-A induction at day2. (B) F2+/F3+ and F2+/F3− fractions were isolated from day5 EBs, plated in liver media in the presence of MTG and analyzed for CD4-Foxa2, Afp and albumin expression by flow cytometry at day12 of differentiation. (C) CD4-Foxa2 endoderm cell numbers obtained 2 days following plating of either 90,000 or 180,000 day5 F2+/F3+ cells in the absence or presence of MTG in the media. (D) Expression of CD25-Foxa3, Flk-1, CD31 at day5 of differentiation and at day7 following plating of either the day5 F2+/F3+ or F2+/F3− populations.
Fig. 2
Fig. 2. D4T endothelial cells promote F2+/F3+ endoderm cell expansion and hepatic specification
(A, B, C) Numbers of endoderm CD4-Foxa2 cells (×104) following 2 days plating in hepatic media in the absence of MTG of day5 isolated F2+/F3+ (90,000 cells) cultured alone (control), or in the presence of 20,000 D4T, eEND2, Huvec or 3T3 cells, or 50% of conditioned media from D4T cells (D4T CM). The % of CD4-Foxa2 endoderm cells, D4T and CD4-Foxa2 proliferative cells were defined by flow cytometry using antibodies against CD4, CD31 and BrdU/CD4, respectively. BrdU was added to each condition 1-hour prior to collecting cells (C). (D–H) Co-immunostaining for Foxa2 (red), Afp (green) and Dapi (blue) at day7 in the culture dish of the 4 condition cultures described in (B,C). Rabbit and goat IgG control is represented in (H). (I) qPCR-based quantitative analysis of Afp transcript levels in the 4 conditions harvested at day7. Expression levels have been adjusted to reflect the proportion of CD4-Foxa2 endoderm cells for each condition. All results are from one representative experiment (n=3). Original magnification: ×100 (D–H).
Fig. 3
Fig. 3. Co-culture of F2+/F3+ endoderm with D4T cells affects Wnt and Notch signaling pathways
(A) Isolated day5 F2+/F3+ endoderm and D4T cells were cultured either separately or co-cultured for 72–90-hours in hepatic media and then isolated by FACS. (B) Proliferation rate of CD4-Foxa2 cells following 72-hours plating in hepatic media of day5 F2+/F3+ (90,000 cells) cultured alone (Alone) or in the presence of 10,000 D4T cells (Co-culture). (C) qPCR analysis of Afp transcript fold changes in endoderm cultured alone or co-cultured with D4T cells for 72-hours. Expression levels have been adjusted to reflect the proportion of CD4-Foxa2 endoderm cells for each condition. (D–G) qPCR analysis of Wnt (D,F) and Notch (E,G) signaling components in endoderm or D4T cells cultured alone or co-cultured for 90-hours and subsequently isolated. Errors bars represent the standard deviation of means from 5, 7 or 2 independent experiments in graphs (B), (C) and (D–G), respectively. In graphs (D–G), * represents the significant differences between the “endoderm alone” group and the “endoderm sorted” or “co-culture” groups.
Fig. 4
Fig. 4. Dynamic changes of Wnt and Notch pathways components upon co-culture
Co-cultured cells (black) or endoderm cultured alone (grey) were harvested at 0, 24, 48, 72 and 90 -hours following plating. Graphs represent relative gene expression levels. These results are from one representative experiment (n=3). * Represent the significant differences that are at least 2-fold different between the co-cultures and endoderm cultured alone for a specific time point.
Fig. 5
Fig. 5. D4T endothelial cells promote expansion and hepatic specification of ENDM1 endoderm cell from E8.25 embryos
ENDM1+/SSClow (E+) and ENDM1/SSClow (E) cells were isolated by FACS from dissociated E8.25 embryos. Both populations were cultured alone (A,C) or co-cultured with D4T cells (B,D,E) for 72-hours in hepatic media. (A–G) Cells were either fixed and immunostained in the dish for Afp (green), CD31 (red) and for Dapi (blue), or (H–J) processed for RNA to evaluate by qPCR relative Afp, transthyretin and albumin expression adjusted to reflect the proportion of endoderm cells in co-cultures. (F) and (G) represent respectively endoderm cell numbers and the % of endoderm cells that expressed Afp, quantified from analysis of 4 to 6 pictures taken from the ENDM1+ cells cultured alone or co-cultured with D4T cells. Endoderm cells were defined as cells whose membrane did not express CD31, and the Afp+ cells were recognized by the Afp green staining. (K,L) qPCR-based quantitative expression of Wnt and Notch signaling components in co-culture or culture alone conditions. (A–E) Original magnification ×200. These data were generated from one representative experiment (n=4). In graphs (F–L), * depict the significant differences between the culture alone (E+, green) and co-cultures (E+ D4T, grey).
Fig. 6
Fig. 6. Modulations of Wnt and Notch pathways affect endoderm expansion and hepatic specification
Isolated day5 F2+/F3+ endoderm cells were cultured for 72-hours alone (A, G–K green columns), co-cultured with D4T cells (B–F, G–I grey columns) either in the presence of Wnt3a (C,G–K 100ng/ml), Dkk1 (D,G–K 200ng/ml), GSI (E,G–K 4µM), a blocking Dkk-1 antibody (G–I, 30µg/ml), or with the combination of Dkk1 and GSI (G–K). PBS was used as control for Dkk1, Dkk1 antibody and Wnt3a conditions, and DMSO for GSI conditions. Cells were either fixed and immunostained in the dish for Foxa2 (green) and Afp (red) (A–E), harvested, counted and processed for flow cytometry analysis for CD4-Foxa2 and CD31 expression to determine endoderm cell numbers (G,J); or were processed for RNA to evaluate relative Afp or transthyretin expression by qPCR (H,I,K). Graphs represent the means of triplicates of endoderm cell proliferation fold (G,J) or relative expression fold changes for Afp (H,K) and for transthyretin (I) from 3 to 6 independent experiments. * Depict the significant differences between the culture controls (PBS, DMSO) and the treated cultures. (F) Represents the goat and rabbit IgG control for immunostaining. The orange dotted lines represent the control levels. (A–F) Original magnification ×50.
Fig. 7
Fig. 7. Notch and Wnt pathway repression in endoderm cells is required for endothelial cell-dependent endoderm hepatic specification
NICD (A–D) or sβ-cat (E,F) Dox inducible ES cell lines were used to generate day5 ENDM1+ endoderm cells. (A,B,E,F) Day5 ENDM1+ endoderm cells were isolated and plated alone (grey) or co-cultured with D4T cells (black) for 72-hours in the presence or absence of Dox (2µg/ml). (C,D) ENDM1+ endoderm cells were cultured alone or co-cultured with D4T cells for 90-hours in the presence of PBS, DMSO, GSI for 90-hours (GSI), GSI for 48-hours and then Dox for the following 42-hours (GSI+Dox) or with Dox for 90-hours (Dox). (A,C) Represent endoderm proliferation fold from triplicate from 3 experiments and (E) the endoderm cell number from one representative experiment (n=3). (B,D,F) The relative Afp expression of each group harvested 72- or 90- hours following plating assessed by qPCR. (B) Is from triplicates of 3 experiments and (D,F) are a representative experiments (n=3). (D,F) Identical scales are used for both graphs. * Depict the significant differences between the Dox treated and untreated groups (A,B,E,F), or between the pharmacologically treated and control (PBS, DMSO) groups (C,D).

Similar articles

Cited by

References

    1. Zaret KS. Liver specification and early morphogenesis. Mech Dev. 2000;92:83–88. - PubMed
    1. Si-Tayeb K, Lemaigre FP, Duncan SA. Organogenesis and development of the liver. Dev Cell. 18:175–189. - PubMed
    1. Crossley PH, Martin GR. The mouse Fgf8 gene encodes a family of polypeptides and is expressed in regions that direct outgrowth and patterning in the developing embryo. Development. 1995;121:439–451. - PubMed
    1. Jung J, Zheng M, Goldfarb M, et al. Initiation of mammalian liver development from endoderm by fibroblast growth factors. Science. 1999;284:1998–2003. - PubMed
    1. Rossi JM, Dunn NR, Hogan BL, et al. Distinct mesodermal signals, including BMPs from the septum transversum mesenchyme, are required in combination for hepatogenesis from the endoderm. Genes Dev. 2001;15:1998–2009. - PMC - PubMed

Publication types

MeSH terms