. 2011 Feb;29(2):274-85.
doi: 10.1002/stem.584.

Transplanted stem cell-secreted vascular endothelial growth factor effects poststroke recovery, inflammation, and vascular repair

Affiliations

Transplanted stem cell-secreted vascular endothelial growth factor effects poststroke recovery, inflammation, and vascular repair

Nobutaka Horie et al. Stem Cells. 2011 Feb.

Abstract

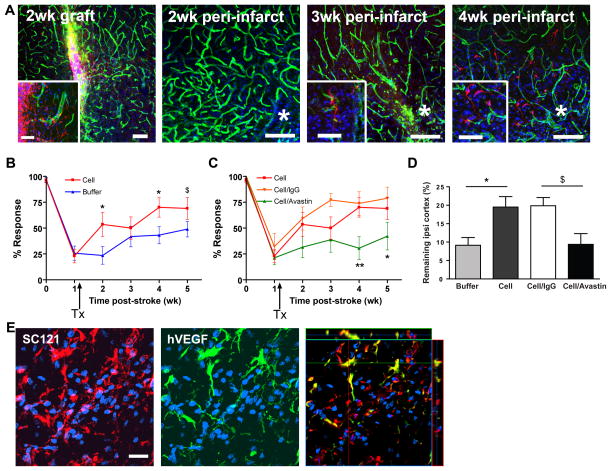
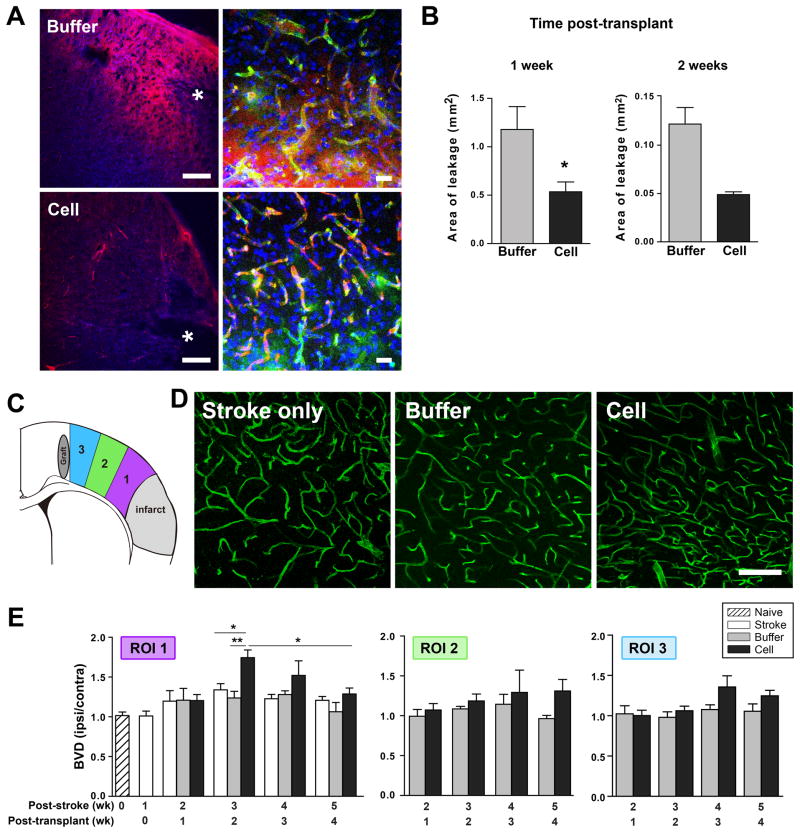
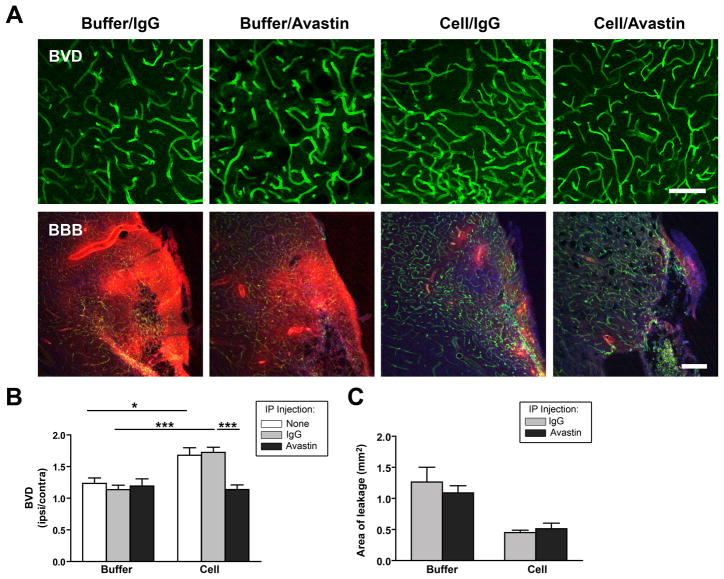
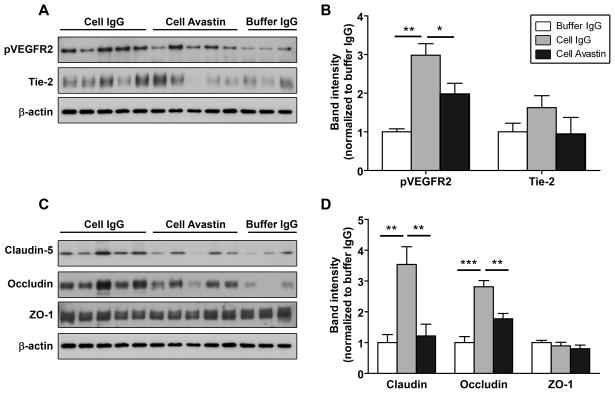
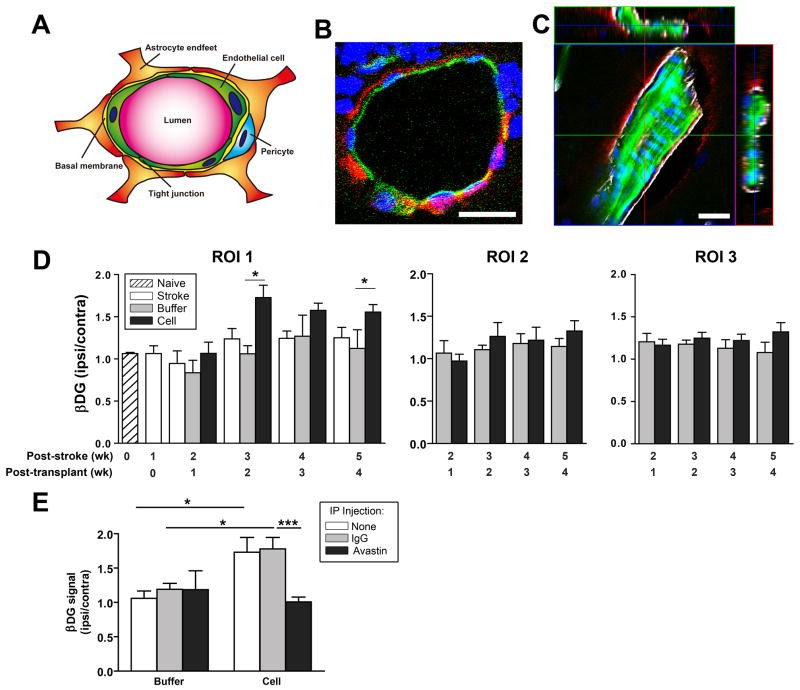
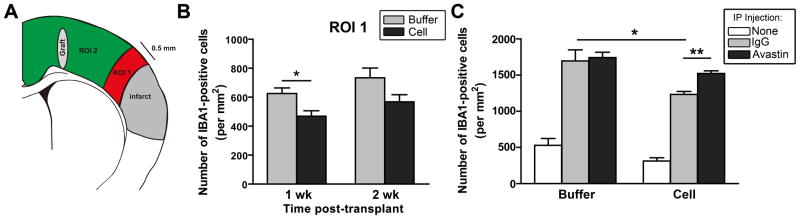
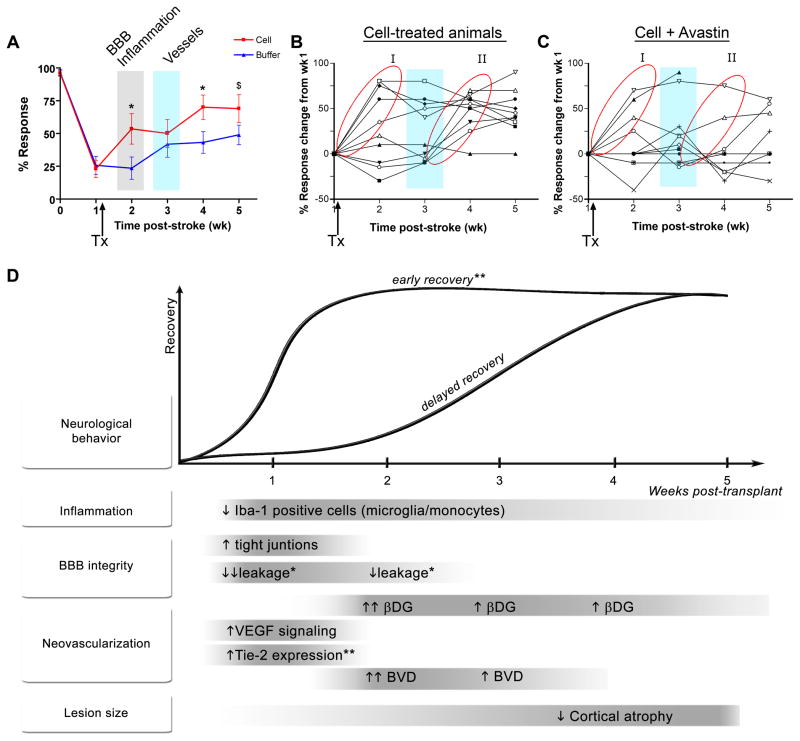
Cell transplantation offers a novel therapeutic strategy for stroke; however, how transplanted cells function in vivo is poorly understood. We show for the first time that after subacute transplantation into the ischemic brain of human central nervous system stem cells grown as neurospheres (hCNS-SCns), the stem cell-secreted factor, human vascular endothelial growth factor (hVEGF), is necessary for cell-induced functional recovery. We correlate this functional recovery to hVEGF-induced effects on the host brain including multiple facets of vascular repair and its unexpected suppression of the inflammatory response. We found that transplanted hCNS-SCns affected multiple parameters in the brain with different kinetics: early improvement in blood-brain barrier integrity and suppression of inflammation was followed by a delayed spatiotemporal regulated increase in neovascularization. These events coincided with a bimodal pattern of functional recovery, with, an early recovery independent of neovascularization, and a delayed hVEGF-dependent recovery coincident with neovascularization. Therefore, cell transplantation therapy offers an exciting multimodal strategy for brain repair in stroke and potentially other disorders with a vascular or inflammatory component.


Conflict of interest statement

Disclosure of Potential Conflicts of Interest:

S.H. is a full time employee of StemCells Inc, the company that provided the cells, and has equity (stock) in the company. The other authors have no financial interests to disclose.

Figures

Figure 1
Figure 1. hCNS-SCns enhance functional recovery and reduce cortical atrophy in a hVEGF-dependent manner
(A) hCNS-SCns (red: human cytoplasmic marker SC121) survive and migrate over time; green: lectin-positive blood vessels; blue: DAPI. * indicates lesion. Inset: higher magnification of hCNS-SCns. Scale: 100μm (50μm in inset, except 3 wk inset: 25μm). (B) hCNS-SCns-treated animals (n=10) showed significantly improved behavioral recovery after stroke compared to buffer-treated animals (n=14). TX: transplantation. P=0.032 by repeated measures ANOVA; * p<0.05; $ p=0.06 by t-test. (C) Avastin treatment significantly blocked hCNS-SCns-induced recovery. p=0.02 by repeated measures ANOVA between cell/Avastin and cell groups; * p<0.05; ** p<0.01 by t-test; cell/Avastin: n= 12–9; cell/IgG: n=7–4, (wk (0–3) - wk (4–5)). (D) The volume of the remaining ipsilesional cortex was significantly larger in hCNS-SCns-treated versus buffer-treated animals at 4 wk post-transplantation; this effect was blocked by Avastin. * p<0.05 by t-test; $ p=0.06 by Mann-Whitney; n=4–5. (E) hCNS-SCns (red) express hVEGF (green). The anti-VEGF antibody is specific for human VEGF and does not cross react with rat VEGF Scale: 50μm.
Figure 2
Figure 2. hCNS-SCns enhance BBB integrity and neovascularization after stroke with different kinetics
(A) Confocal image at 1 wk post-transplantation illustrating less biotin leakage (red) in the peri-infarct area of cell- versus buffer-treated animals. Higher magnification: biotin leaks from vessels into the parenchyma in buffer- but not cell-treated animals. * indicates lesion. Scale: 200μm, 20μm in higher magnification images. (B) Quantification of biotin leakage; * p<0.05 by t-test. N= 5–6 at 1 wk; n=3 at 2 wk. (C) Schematic showing regions of interest (ROI) analyzed for blood vessel density. (D) Confocal images of lectin-perfused vessels in the peri-infarct cortex (ROI 1) at 2 wk post-transplantation. Scale: 100μm. (E) Quantification of the blood vessel density (BVD) in the ROIs over time. Cell-treated animals exhibit a general trend of enhanced neovascularization that is most pronounced in the peri-infarct area (ROI 1) at 2 wk post-transplantation; p=0.004 by one way ANOVA at 2 wk post-transplantation with * p<0.05, ** p<0.01 by Tukey post-hoc test. Comparison of cell group 2 & 4 wk post-transplant by Mann-Whitney test. Cell group: n=6 & buffer group: n=4–5 at 1 & 2 wk post-transplant; n=3–5 other groups.
Figure 3
Figure 3. Avastin blocks cell-induced neovascularization but not BBB repair
(A) Confocal images showing blood vessel density (BVD) of lectin-stained blood vessels (green) and BBB leakage of biotin (red) at 2 wk after cell or buffer transplantation in animals treated with IgG or Avastin. Scale: BVD:100μm; BBB: 200μm. (B) Quantification revealed that Avastin blocks hCNS-SCns-enhanced vascularization; * p<0.05; ** p<0.01; *** p<0.001 by t-test. N=4 for buffer/Avastin, n=5–8 for all other groups. (C) Avastin did not affect the relative BBB leakage of biotin in cell or buffer animals. N=5 for IgG treated animals; n=3–4 for Avastin-treated animals.
Figure 4
Figure 4. hCNS-SCns increase expression of angiogenic receptors and tight junction proteins
(A & C) Representative Western blot analysis of ipsilesional cortical microvessels isolated from brains at 1 wk post-transplantation. (B & D) Quantification of the Western blots for the relative expression of angiogenic receptors (B) and tight junction proteins (D). Cell-treated animals show enhanced expression of pVEGR2, Tie-2, claudin 5 and occludin, and this is blocked by Avastin treatment. Note: the buffer/Avastin group is omitted for clarity but did not differ from the buffer/IgG group. Buffer groups: n=6, cell groups: n=5. * p<0.05; *** p<0.001 by t-test.
Figure 5
Figure 5. hCNS-SCns enhanceβ-dystroglycan protein expression after stroke
(A) Schematic of cellular components of the blood brain barrier. (B) βDG (red) does not colocalize with endothelial cells at least in the larger vessels (green, lectin) but does colocalize with the astrocytic end foot marker Aquaporin-4 (white) (C). Scale: 20μm. (D) Quantification of βDG expression in the ROIs over time (defined in Figure 2). hCNS-SCns significantly enhance βDG levels in the peri-infarct area starting 2 wk post-transplantation; p=0.01 by one way ANOVA at both 2 wk and 4 wk post-transplantation with * p<0.05 by Tukey post-hoc test; N as in Figure 1. (E) Avastin blocks hCNS-SCns-enhanced βDG expression at 2 wk post-transplantation; * p<0.05; *** p<0.001 by t-test. N=4 for buffer/Avastin, n=5–8 for all other groups.
Figure 6
Figure 6. hCNS-SCns reduce inflammation after stroke
(A) Schematic showing ROIs for Iba 1-positive monocytes/macrophages counting. The peri-infarct region (ROI 1) is defined as the area extending 0.5 mm from the lesion edge. (B) Stereological counting revealed that hCNS-SCns-treated animals have fewer Iba 1-positive cells than buffer-treated animals in ROI 1 at 1 wk post-transplantation. *p<0.05 by t-test; n=4–6. (C) In IgG-injected animals, hCNS-SCns still had less inflammation than buffer-treated animals; this immunosuppression was inhibited by Avastin. * p<0.05; ** p<0.01 by t-test; n=4 buffer/Avastin, n=5–6 for all other groups.
Figure 7
Figure 7. Correlation of hCNS-SCns-induced recovery with hCNS-SCns-induced brain changes
(A) Overlaying the recovery graph with timing of hCNS-SCns-induced brain changes reveals that early cell-enhanced recovery occurs before changes in neovascularization. (B) Graph of the behavioral response of individual cell-treated animals reveals two distinct groups of recovery, I and II. (C) Graph of the behavior response of individual cell/Avastin-treated animals; Avastin blocks recovery of Group II. Arrow indicates time of transplantation (TX). Blue vertical bar: time of peak neovascularization. (D) Schematic summarizing the changes induced by transplanted hCNS-SCns and the temporal relationship of these events to each other and to hCNS-SCns-enhanced functional recovery. Avastin affected all parameters except for the ones marked *. Inconclusive effects of Avastin are indicated by **.

References

    1. Borlongan CV, Tajima Y, Trojanowski JQ, et al. Transplantation of cryopreserved human embryonal carcinoma-derived neurons (NT2N cells) promotes functional recovery in ischemic rats. Exp Neurol. 1998;149:310–321. - PubMed
    1. Chen J, Sanberg PR, Li Y, et al. Intravenous administration of human umbilical cord blood reduces behavioral deficits after stroke in rats. Stroke. 2001;32:2682–2688. - PubMed
    1. Hicks AU, Lappalainen RS, Narkilahti S, et al. Transplantation of human embryonic stem cell-derived neural precursor cells and enriched environment after cortical stroke in rats: cell survival and functional recovery. Eur J Neurosci. 2009;29:562–74. - PubMed
    1. Stroemer P, Hope A, Patel S, et al. Development of a human neural stem cell line for use in recovery from disability after stroke. Front Biosci. 2008;13:2290–2. - PubMed
    1. Bliss T, Guzman R, Daadi M, et al. Cell transplantation therapy for stroke. Stroke. 2007;38:817–826. - PubMed

Publication types

Substances