

Spectral modification and catalytic inhibition of human cytochromes P450 1A1, 1A2, 1B1, 2A6, and 2A13 by four chemopreventive organoselenium compounds
- PMID: 21732699
- PMCID: PMC3156385
- DOI: 10.1021/tx200218u
Spectral modification and catalytic inhibition of human cytochromes P450 1A1, 1A2, 1B1, 2A6, and 2A13 by four chemopreventive organoselenium compounds
Abstract
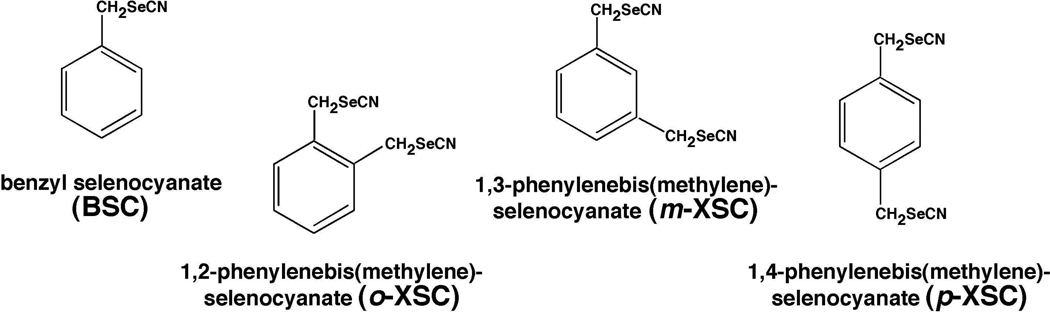
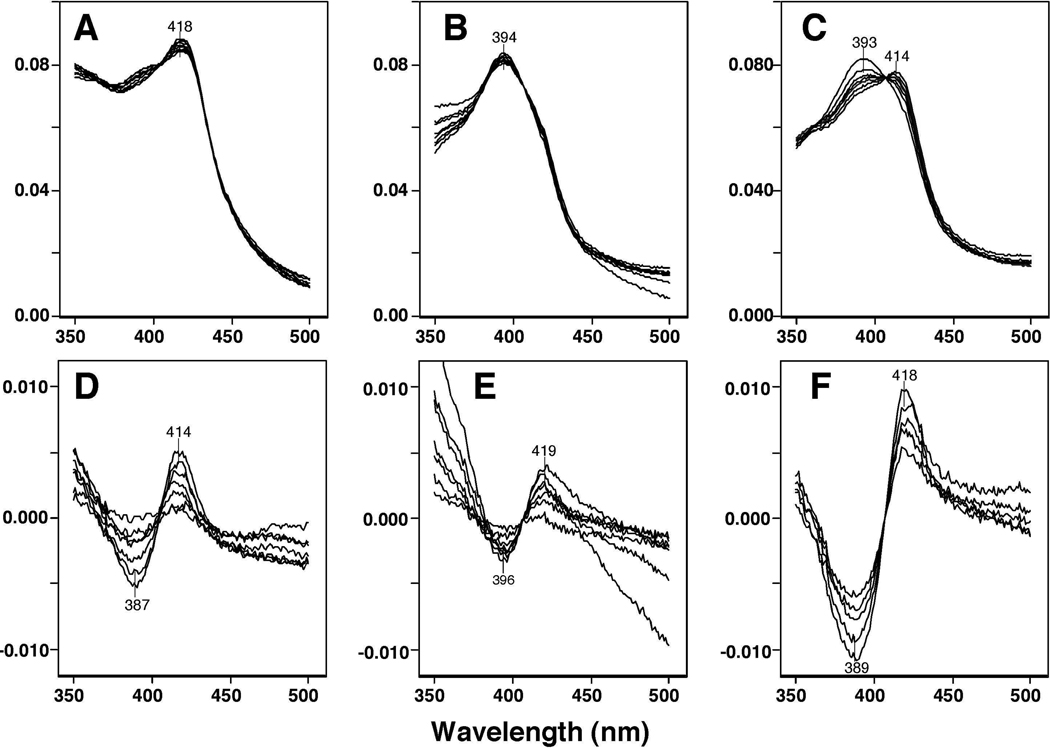
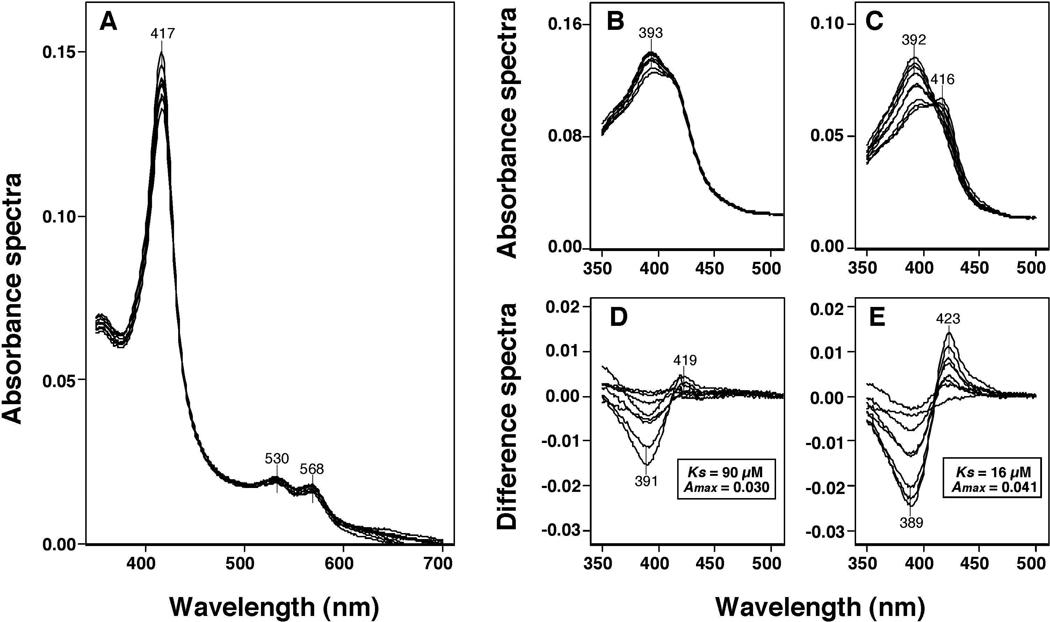
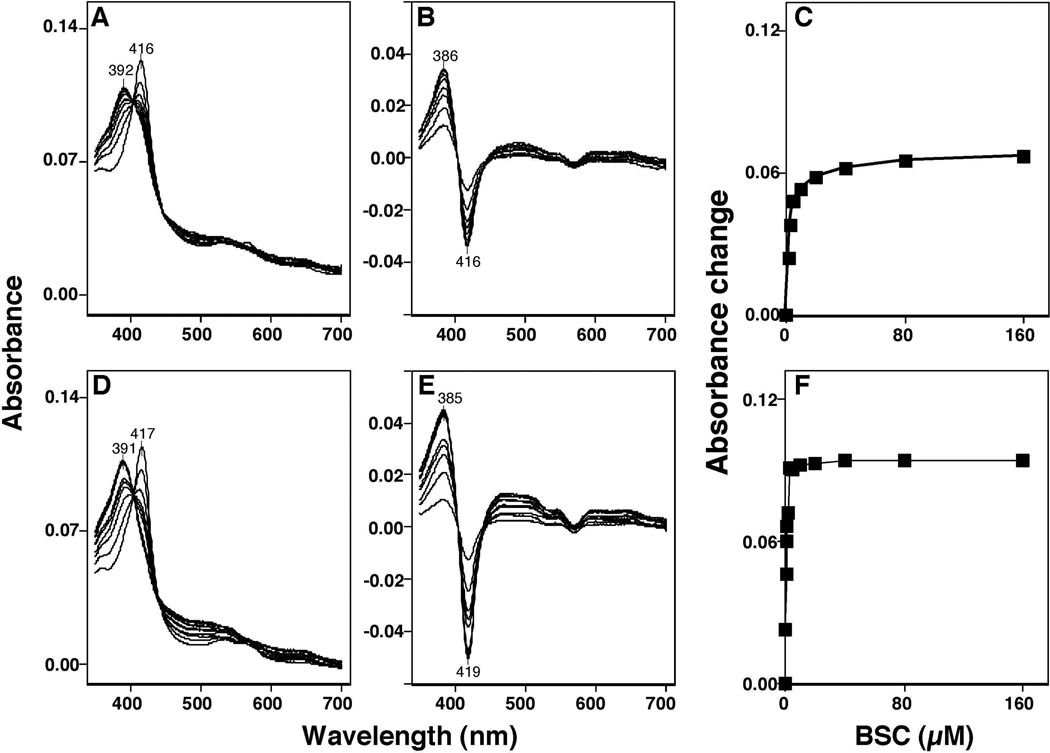
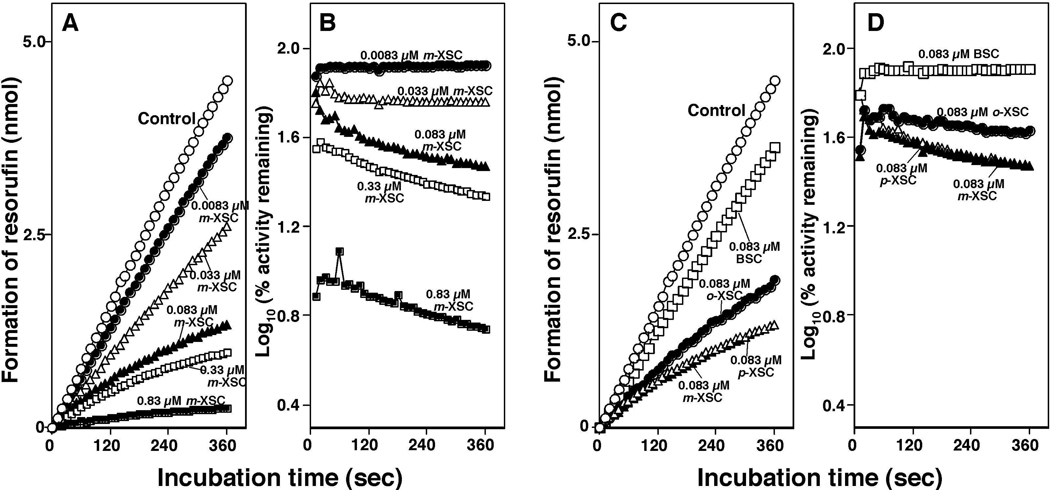
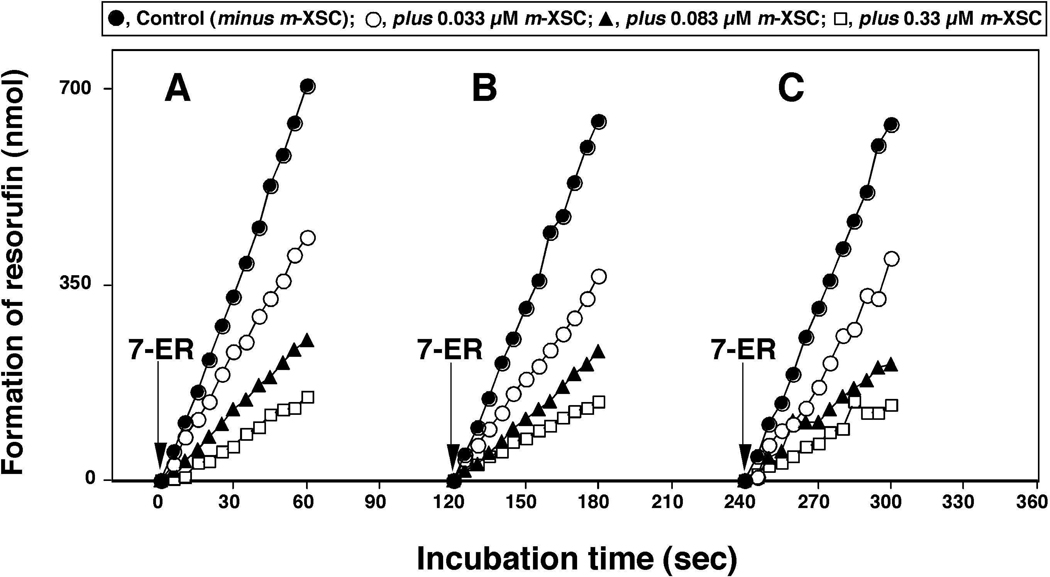
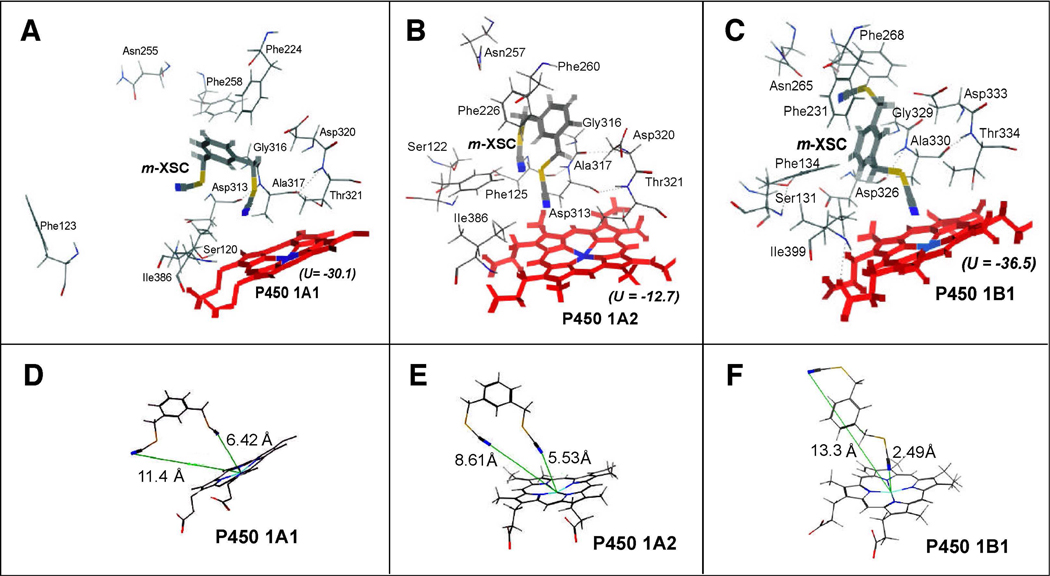
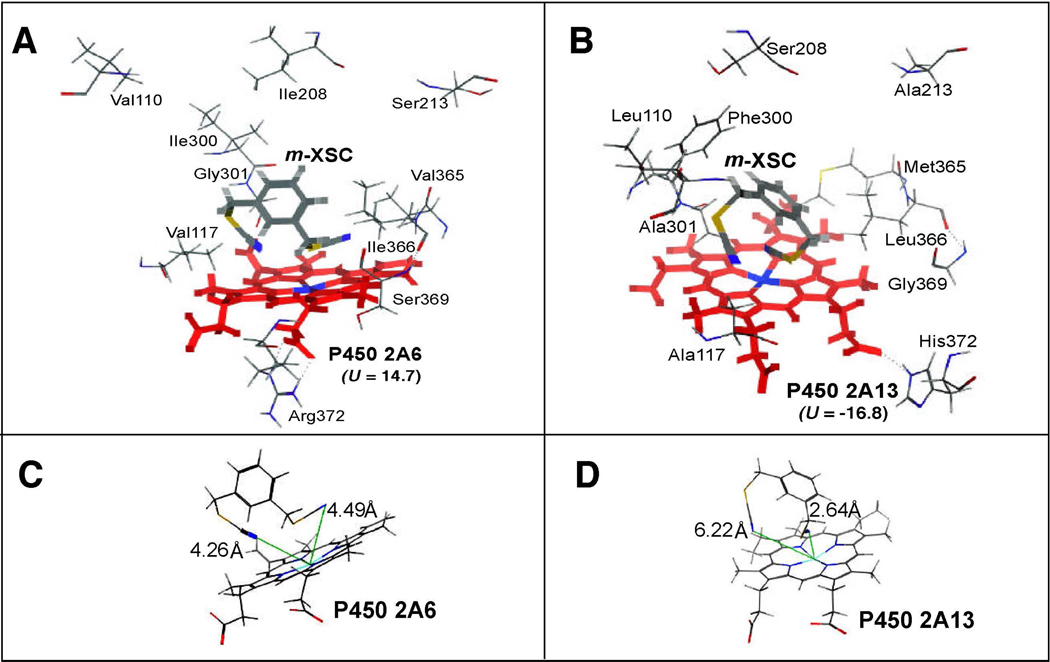
Several organoselenium compounds including benzyl selenocyanate (BSC), 1,2-phenylenebis(methylene)selenocyanate (o-XSC), 1,3-phenylenebis(methylene)selenocyanate (m-XSC), and 1,4-phenylenebis(methylene)selenocyanate (p-XSC) have been shown to prevent cancers caused by polycyclic aromatic hydrocarbons (PAHs) and 4-(methylnitrosamino)-1-(3-pyridyl)-1-butanone (NNK) in experimental animals; these chemical carcinogens are activated by human P450 1 and 2A family enzymes, respectively, to carcinogenic metabolites. In this study, we examined whether these selenium compounds interact with and inhibit human P450 1 and 2A enzymes in vitro. Four organoselenium compounds induced reverse Type I binding spectra with P450 1A1, 1A2, and 1B1 and Type I binding spectra with P450 2A6 and 2A13. The spectral dissociation constants (K(s)) for the interaction of P450 1B1 with these chemicals were 3.6-5.7 μM; the values were lower than those with seen with P450 1A1 (19-30 μM) or 1A2 (6.3-13 μM). The K(s) values for Type I binding of P450 2A13 with m-XSC and BSC were both 0.20 μM; the values were very low compared to those for the interaction of P450 2A6 with m-XSC (5.7 μM) and BSC (2.0 μM). Four selenium compounds directly inhibited 7-ethoxyresorufin O-deethylation activities catalyzed by P450 1A1, 1A2, and 1B1 with IC(50) values <1.0 μM, except for the inhibition of P450 1A2 by BSC (1.3 μM). Coumarin 7-hydroxylation activities of P450 2A13 were more inhibited by four selenium compounds than those of P450 2A6, with IC(50) values of 0.22-1.4 μM for P450 2A13 and 2.4-6.2 μM for P450 2A6. Molecular docking studies of the interaction of four organoselenium compounds with human P450 enzymes suggest that these chemicals can be docked into the active sites of these human P450 enzymes and that the sites of the selenocyanate functional groups of these chemicals differ between the P450 1 and 2A family enzymes.
Figures
References
-
- Reddy BS, Upadhyaya P, Simi B, Rao CV. Evaluation of organoselenium compounds for potential chemopreventive properties in colon carcinogenesis. Anticancer Res. 1994;14:2509–2514. - PubMed
-
- Ip C, El-Bayoumy K, Upadhyaya P, Ganther H, Vadhanavikit S, Thompson H. Comparative effect of inorganic and organic selenocyanate derivatives in mammary cancer chemoprevention. Carcinogenesis. 1994;15:187–192. - PubMed
-
- Fiala ES, Joseph C, Sohn OS, El-Bayoumy K, Reddy BS. Mechanism of benzylselenocyanate inhibition of azoxymethane-induced colon carcinogenesis in F344 rats. Cancer Res. 1991;51:2826–2830. - PubMed
-
- Nayini J, El-Bayoumy K, Sugie S, Cohen LA, Reddy BS. Chemoprevention of experimental mammary carcinogenesis by the synthetic organoselenium compound, benzylselenocyanate, in rats. Carcinogenesis. 1989;10:509–512. - PubMed
-
- Richie JP, Jr, Kleinman W, Desai DH, Da A, Amin SG, Pinto JT, El-Bayoumy K. The organoselenium compound 1,4-phenylenebis(methylene)selenocyanate inhibits 4-(methylnitrosamino)-1-(3-pyridyl)-1-butanone-induced tumorgenesis and enhances glutathione-related antioxidant levels in A/J mouse lung. Chem.-Biol. Interact. 2006;161:93–103. - PubMed
Publication types
MeSH terms
Substances
Grants and funding
LinkOut - more resources
Full Text Sources
