Comparative Study
. 2011 Nov 1;439(3):497-504.
doi: 10.1042/BJ20110803.

MAL, but not MAL2, expression promotes the formation of cholesterol-dependent membrane domains that recruit apical proteins

Affiliations
Comparative Study

MAL, but not MAL2, expression promotes the formation of cholesterol-dependent membrane domains that recruit apical proteins

Sai P Ramnarayanan et al. Biochem J. .

Abstract

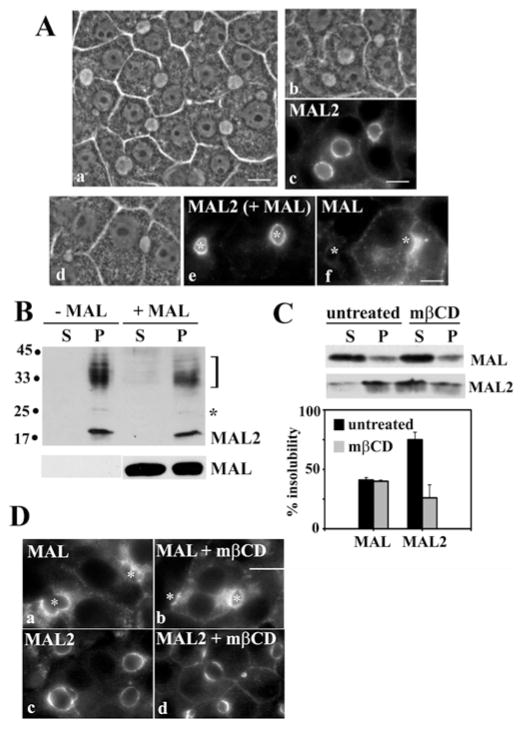
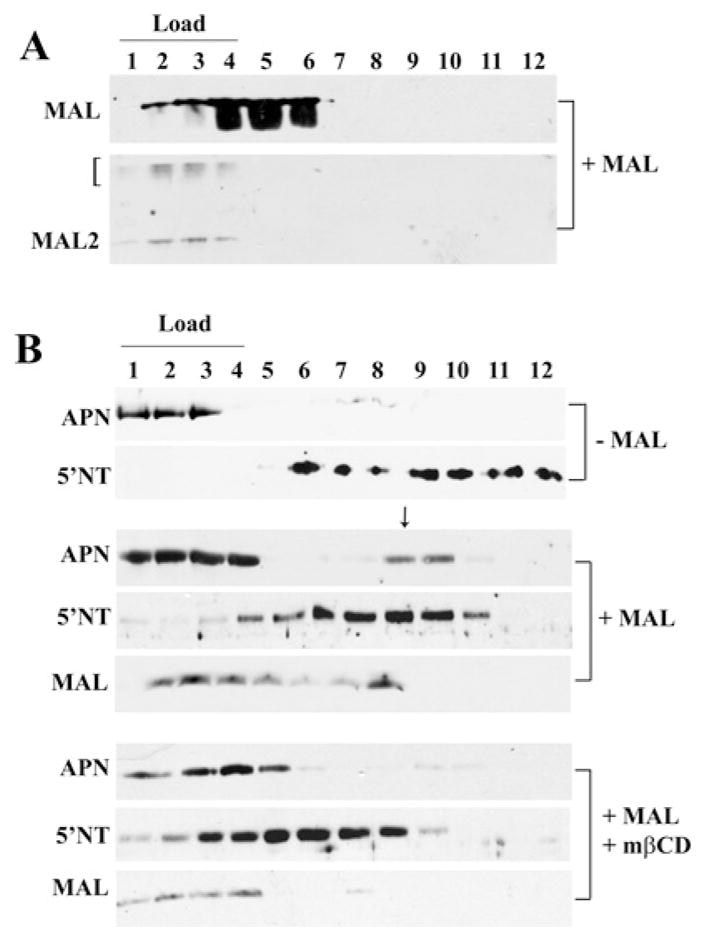
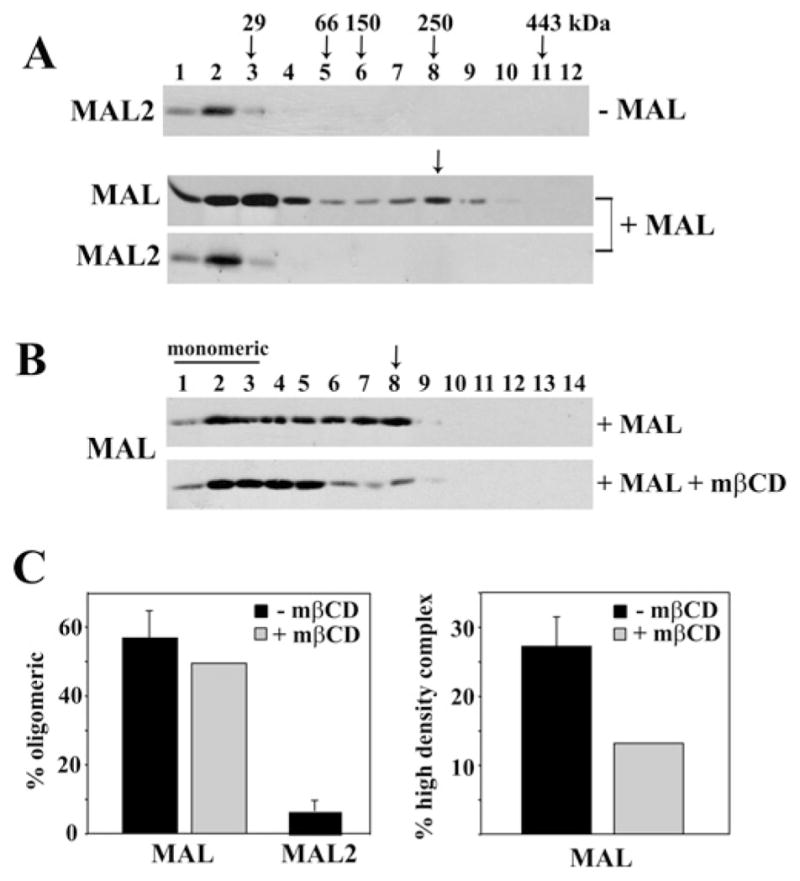
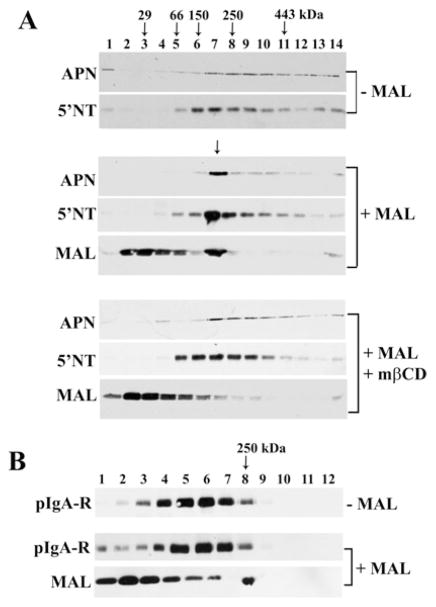
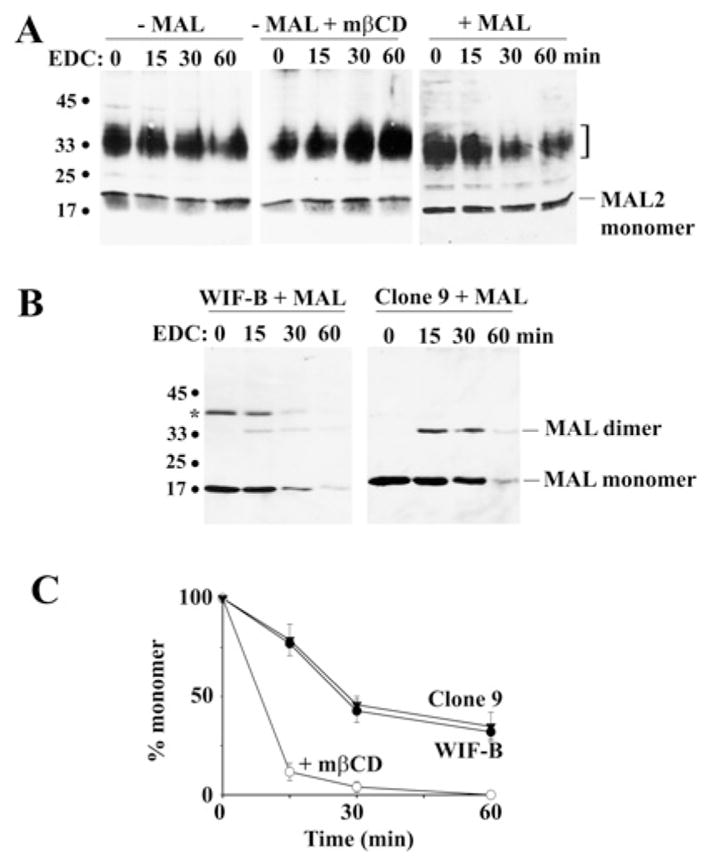
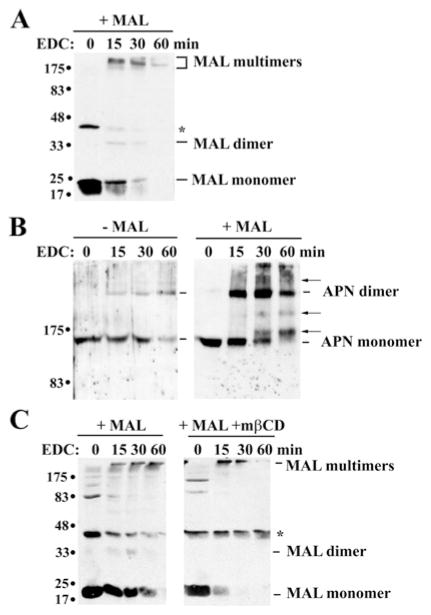
Our recent studies have been aimed at understanding the mechanisms regulating apical protein sorting in polarized epithelial cells. In particular, we have been investigating how lipid rafts serve to sort apical proteins in the biosynthetic pathway. The recent findings that lipid domains are too small or transient to host apically destined cargo have led to newer versions of the hypothesis that invoke proteins required for lipid domain coalescence and stabilization. MAL (myelin and lymphocyte protein) and its highly conserved family member, MAL2, have emerged as possible regulators of this process in the direct and indirect apical trafficking pathways respectively. To test this possibility, we took a biochemical approach. We determined that MAL, but not MAL2, self-associates, forms higher-order cholesterol-dependent complexes with apical proteins and promotes the formation of detergent-resistant membranes that recruit apical proteins. Such biochemical properties are consistent with a role for MAL in raft coalescence and stabilization. These findings also support a model whereby hydrophobic mismatch between the long membrane-spanning helices of MAL and the short-acyl-chain phospholipids in the Golgi drive formation of lipid domains rich in raft components that are characterized by a thicker hydrophobic core to alleviate mismatch.


Figures

Figure 1
Figure 1. MAL2 insolubility in Triton X-100 and cellular distribution are cholesterol-dependent
(A) Uninfected (panels a–c) or cells exogenously expressing MAL (panels d–f) were immunolabelled for MAL or MAL2 as indicated. Corresponding phase images are also shown (panels b and d). A low-magnification phase-contrast image (panel a) shows the characteristic hepatic polarity exhibited by WIF-B cells. (B) Uninfected and MAL-expressing cells were extracted in ice-cold lysis buffer containing 1 % (v/v) Triton X-100 and centrifuged at 120 000 g for 30 min at 4 °C. Resultant supernatants (S) and pellets (P) were immunoblotted for MAL and MAL2. Molecular-mass markers are indicated on the left in kDa. The bracket highlights a 30–38 kDa diffuse set of MAL2-cross-reactive bands that has been described by others and the asterisk indicates a 25 kDa species also detected by others (see the text). (C) Uninfected (for MAL2 immunoblots) and MAL-expressing cells (for MAL immunoblots) were treated for 60 min with 5 mM mβCD at 37 °C to deplete cholesterol and lysed as described in (B). The resultant supernatants (S) and pellets (P) were immunoblotted for MAL or MAL2 as indicated. The histogram indicates the percentage insolubility of MAL and MAL2. Results are means ± S.E.M. Measurements were performed on at least three independent experiments. (D) Uninfected (panels c and d) or MAL-expressing (panels a and b) cells were cholesterol-depleted as described in (C) and immunolabelled for MAL (panels a and b) or MAL2 (panels c and d). Asterisks mark selected bile canaliculi. Scale bar, 10 μm.
Figure 2
Figure 2. MAL expression alters the buoyant densities of apical proteins
(A) MAL-expressing cells were lysed in ice-cold buffer containing 1 % (v/v) Triton X-100 and subjected to low-density flotation (see the Experimental section). The first four fractions correspond to the load. Fractions were immunoblotted for MAL or MAL2 as indicated. The bracket on the left highlights a 30–38 kDa diffuse set of MAL2 cross-reactive bands. (B) Uninfected (upper panels) or MAL-expressing cells (middle and bottom panels) were incubated in the absence (top five panels) or presence (bottom three panels) of 5 mM mβCD at 37 °C for 30 min and subjected to low-density flotation as described in (A). Fractions were immunoblotted for APN, 5′NT or MAL as indicated.
Figure 3
Figure 3. MAL, but not MAL2, forms high-molecular-mass complexes in WIF-B cells
(A) Uninfected cells (top panel) or cells expressing MAL (bottom two panels) were lysed in ice-cold buffer containing 0.4 % SDS and 0.2 % Triton X-100, then lysates were loaded on top of 5–30 % linear sucrose gradients and centrifuged at 192 000 g for 18 h. Fractions were immunoblotted for MAL and MAL2 as indicated on the left. Arrows above the top panel mark the distributions of the molecular-mass standards (in kDa). The arrow above the bottom two panels indicates fraction 8. (B) MAL-expressing cells were treated in the absence (+ MAL) or presence of 5 mM mβCD (MAL + mβCD) for 30 min and lysed and centrifuged as described in (A). Fractions were immunoblotted for MAL. The fractions containing monomeric MAL are indicated. The arrow points to a higher-density fraction containing MAL. (C) The percentage of total oligomeric MAL or MAL2 in control (+ MAL) or cholesterol-depleted cells (MAL + mβCD) are plotted in the histogram on the left. Results for untreated (− mβCD) cells (black bars) are means ± S.E.M. Measurements were performed on at least three independent experiments. Results for the cholesterol-depleted cells are expressed as the average from two independent experiments. The histogram on the right shows the percentage of MAL present in the high-density fractions. Results for untreated (− mβCD) cells (black bars) are means ± S.E.M. Measurements were performed on at least three independent experiments. Results for cholesterol-depleted cells are expressed as the average from two independent experiments.
Figure 4
Figure 4. The distribution of apical proteins into the MAL-positive high density fractions is cholesterol-dependent
(A) Uninfected cells (top two panels) or MAL-expressing cells (bottom six panels) were incubated in the absence or presence of 5 mM mβCD (MAL + mβCD) for 30 min at 37 °C. Cells were lysed and centrifuged as described in Figure 3. Fractions were immunoblotted for APN, 5′NT and MAL as indicated on the left. The arrows above the top panel mark the distribution of the molecular-mass standards (in kDa). The arrow above the middle panels marks the MAL-positive high-molecular-mass complexes. (B) Cells overexpressing pIgA-R alone (top panel) or pIgA-R and MAL (bottom two panels) were lysed and centrifuged as described in Figure 3. Fractions were immunoblotted for pIgA-R and MAL as indicated on the left. The arrow points to the high-molecular-mass complexes containing MAL.
Figure 5
Figure 5. Cross-linking confirms that MAL, but not MAL2, is present in high-molecular-mass complexes
(A) Uninfected WIF-B cells (left-hand and middle panels) or MAL-expressing cells (+ MAL) were treated in the absence or presence of 5 mM mβCD (+ MAL + mβCD) for 30 min at 37 °C. Post-nuclear membranes were isolated and cross-linked with 10 mM EDC and 2.5 mM sulfo-NHS for 0, 15, 30 and 60 min. Reactions were stopped by the addition of SDS/PAGE sample buffer. Samples were immunoblotted for MAL2. Molecular-mass markers are indicated on the left in kDa. The monomeric form of MAL2 is indicated. The bracket highlights a 30–38 kDa diffuse set of cross-reactive MAL2 bands. (B) Post-nuclear membranes from WIF-B (left-hand panel) or Clone 9 (right-hand panel) cells expressing MAL were cross-linked as described in (A). Samples were immunoblotted for MAL. Molecular-mass markers are indicated on the left in kDa. The relative migrations of the MAL monomeric and dimeric forms are indicated. The asterisk indicates a MAL-cross-reactive species in WIF-B cells that is not detected in Clone 9 cells. (C) The percentage loss of total MAL monomer over time was plotted for untreated (Clone 9 and WIF-B) and treated (WIF-B + mβCD) cells as indicated. Results are means ± S.E.M. Measurements were performed on at least three independent experiments.
Figure 6
Figure 6. Cross-linking confirms that MAL and the apical proteins form cholesterol-dependent high-molecular-mass complexes
(A) Post-nuclear membranes from MAL-expressing cells were cross-linked as described in Figure 5 and samples were immunoblotted for MAL. The relative migrations of MAL monomeric, dimeric and multimeric forms are indicated. The asterisk indicates a MAL-cross-reactive species in WIF-B cells. Molecular-mass markers are indicated on the left in kDa. (B) Postnuclear membranes from uninfected (left-hand panel) or MAL-expressing (right-hand panel) cells were cross-linked as described in Figure 5 and samples were immunoblotted for APN. The APN monomeric and dimeric forms are indicated. Arrows point to cross-linked species detected only in MAL-overexpressing cells. Molecular-mass markers are indicated on the left in kDa. (C) WIF-B cells expressing MAL were treated for 30 min with 5 mM mβCD at 37 °C. Post-nuclear membranes were cross-linked and samples were immunoblotted for MAL. The relative migrations of MAL monomeric, dimeric and multimeric forms are indicated. The asterisk indicates a MAL-cross-reactive species in WIF-B cells. Molecular-mass markers are indicated on the left in kDa.
Figure 7
Figure 7. MAL oligomers dissociate upon apical delivery
(A) MAL-expressing cells were treated with 50 μg/ml cycloheximide (CHX) for 0, 60 or 120 min at 37 °C as indicated. Cells were lysed and centrifuged as described in Figure 3. Fractions were collected and immunoblotted for MAL. The fractions containing monomeric MAL are indicated. (B) The percentage of total oligomeric MAL detected in the gradients shown in (A) is plotted.

Similar articles

Cited by

References

    1. Rodriguez-Boulan E, Kreitzer G, Musch A. Organization of vesicular trafficking in epithelia. Nat Rev Mol Cell Biol. 2005;6:233–247. - PubMed
    1. Weisz OA, Rodriguez-Boulan E. Apical trafficking in epithelial cells: signals, clusters and motors. J Cell Sci. 2009;122:4253–4266. - PMC - PubMed
    1. Bartles JR, Feracci HM, Stieger B, Hubbard AL. Biogenesis of the rat hepatocyte plasma membrane in vivo: comparison of the pathways taken by apical and basolateral proteins using subcellular fractionation. J Cell Biol. 1987;105:1241–1251. - PMC - PubMed
    1. Bartles JR, Hubbard AL. Plasma membrane protein sorting in epithelial cells: do secretory pathways hold the key? Trends Biochem Sci. 1988;13:181–184. - PubMed
    1. Schell MJ, Maurice M, Stieger B, Hubbard AL. 5′nucleotidase is sorted to the apical domain of hepatocytes via an indirect route. J Cell Biol. 1992;119:1173–1182. - PMC - PubMed

Publication types

MeSH terms