. 2011 Sep 2;286(35):30492-30503.
doi: 10.1074/jbc.M110.206516. Epub 2011 Jul 6.

K-Cl cotransporter gene expression during human and murine erythroid differentiation

Affiliations

K-Cl cotransporter gene expression during human and murine erythroid differentiation

Dao Pan et al. J Biol Chem. .

Abstract

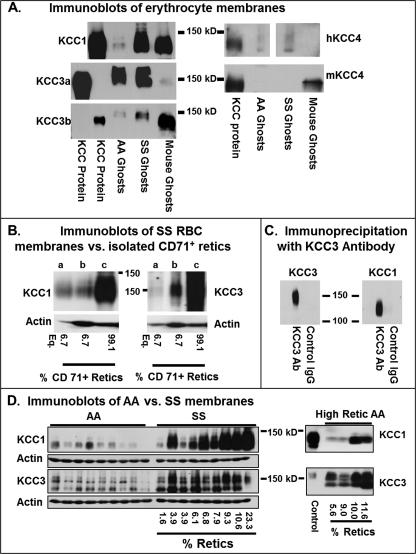
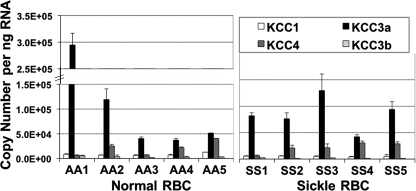
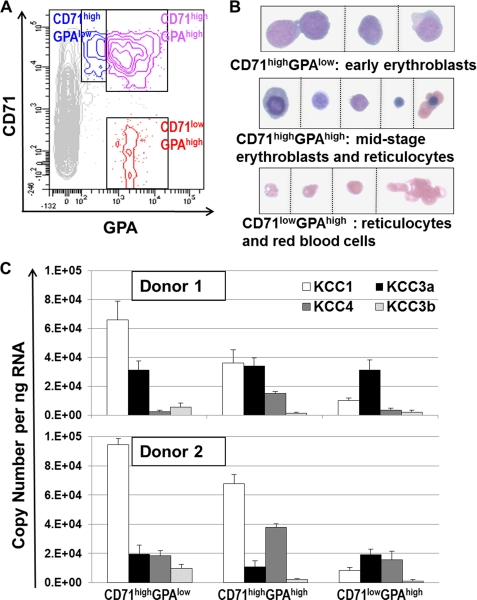
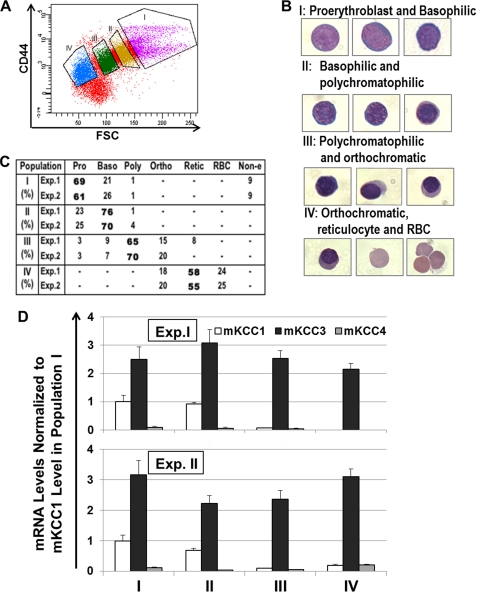
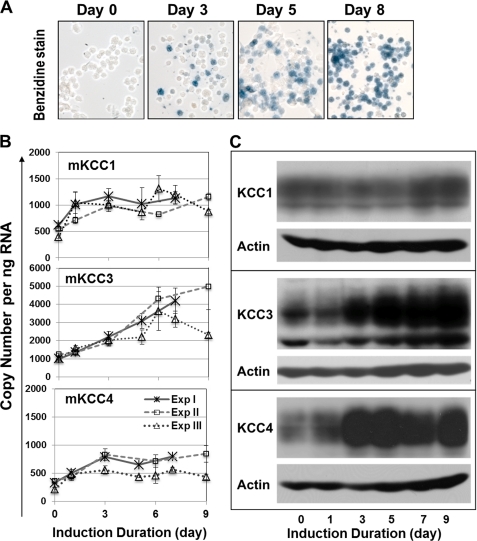
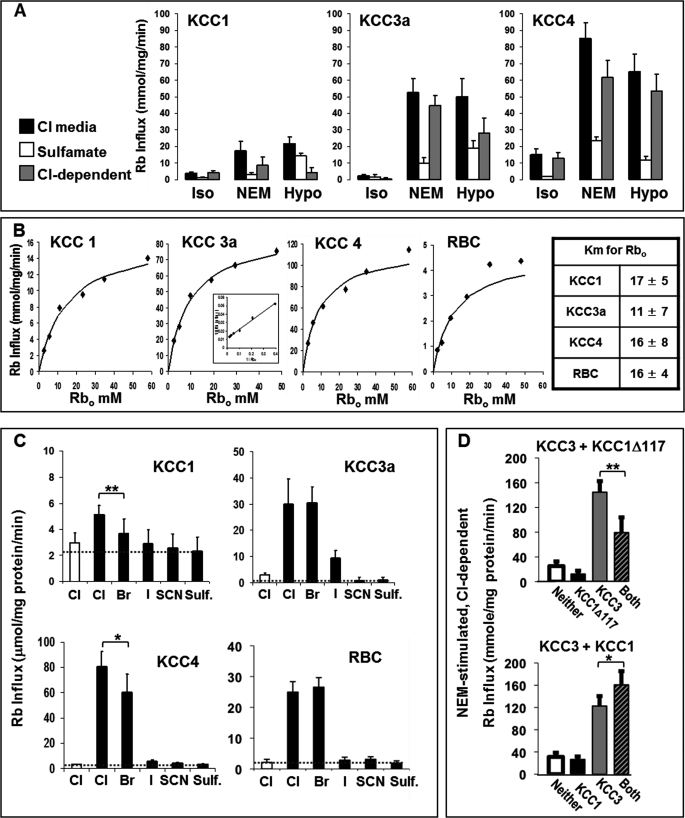
The K-Cl cotransporter (KCC) regulates red blood cell (RBC) volume, especially in reticulocytes. Western blot analysis of RBC membranes revealed KCC1, KCC3, and KCC4 proteins in mouse and human cells, with higher levels in reticulocytes. KCC content was higher in sickle versus normal RBC, but the correlation with reticulocyte count was poor, with inter-individual variability in KCC isoform ratios. Messenger RNA for each isoform was measured by real time RT-quantitative PCR. In human reticulocytes, KCC3a mRNA levels were consistently the highest, 1-7-fold higher than KCC4, the second most abundant species. Message levels for KCC1 and KCC3b were low. The ratios of KCC RNA levels varied among individuals but were similar in sickle and normal RBC. During in vivo maturation of human erythroblasts, KCC3a RNA was expressed consistently, whereas KCC1 and KCC3b levels declined, and KCC4 message first increased and then decreased. In mouse erythroblasts, a similar pattern for KCC3 and KCC1 expression during in vivo differentiation was observed, with low KCC4 RNA throughout despite the presence of KCC4 protein in mature RBC. During differentiation of mouse erythroleukemia cells, protein levels of KCCs paralleled increasing mRNA levels. Functional properties of KCCs expressed in HEK293 cells were similar to each other and to those in human RBC. However, the anion dependence of KCC in RBC resembled most closely that of KCC3. The results suggest that KCC3 is the dominant isoform in erythrocytes, with variable expression of KCC1 and KCC4 among individuals that could result in modulation of KCC activity.


Figures

FIGURE 1.
FIGURE 1.
KCC protein expression in human and mouse erythrocyte membranes. A, immunoblots of RBC membranes with antibodies specific for KCC isoforms. 150 μg of human AA or SS ghosts or mouse ghosts were loaded per lane. 1–3-μg aliquots of whole cell lysate of HEK293 cells stably expressing human KCC1, KCC3a, KCC3b, or KCC4 were used as positive controls. In the KCC3a and KCC3b blots, HEK293-KCC3a lysate was loaded in the 1st lane and HEK293-KCC3b lysate was loaded in the 2nd lane; note the specificity of antibodies for these splicing isoforms. Subtle differences between erythrocyte membranes and control HEK293 membranes are likely due to differences in post-translational modifications (glycosylation, phosphorylation, etc.) between the HEK cell line and the endogenous red blood cell proteins. B, KCC1 and KCC3 immunoblots of RBC membranes from reticulocytes and whole blood. Reticulocytes were isolated from SS blood using magnetic beads coated with TfR antibody as described under “Experimental Procedures.” Isolated retics (lane c) were 99.1% TfR+ by flow cytometry, and the initial whole blood sample (lane b) was 6.7% TfR+ cells. Equivalent amounts (75 μg) of membrane protein were loaded in lanes b and c. The left-hand lane of both blots (lane a) was loaded with 5 μg of isolated retic membrane protein, representing 6.7% of the protein load of lane c. Actin blots reflect the difference in protein loads. C, immunoprecipitation of RBC membrane proteins. Solubilized membranes from AA RBC were precipitated with antibody to KCC3 (see “Experimental Procedures”), with parallel control IgG incubation. Blots were developed with antibodies specific for KCC3 or KCC1 as indicated. KCC3 and KCC1 antibodies did not cross-react (data not shown). D, KCC protein levels in nine AA and nine SS samples. KCC1 antibody was the same as in A; the KCC3 antibody used here detects both a and b splicing isoforms. Reticulocyte counts for SS samples (CellDyne automated cell counter) are given; AA samples in these blots had normal reticulocytes counts (0.5–1.5%). In the right panel, high reticulocyte AA samples were analyzed. Etiologies of reticulocytosis were (left to right) anti-Rh antibody treatment for immune thrombocytopenia, autoimmune hemolytic anemia, recovery from traumatic blood loss, and treated iron deficiency.
FIGURE 2.
FIGURE 2.
KCC isoform RNA levels in normal and sickle reticulocytes. RT-QPCR analysis for KCC RNAs in AA and SS reticulocytes isolated from whole blood by magnetic separation using anti-TfR-coated beads. Data are shown as means ± S.D. of 5–6 measurements for RBC from five normal individuals (AA) and five sickle patients (SS). The amount of RNA in each sample was determined by simultaneous amplification of GAPDH with KCC1 as multiplex reaction, and interpreted by using standard curves with known initial RNA content from HEK293 cells against Ct of GAPDH amplification.
FIGURE 3.
FIGURE 3.
KCC expression during in vivo human erythroid maturation. A, fresh bone marrow cells from normal donors were immunostained with CD71-CyChrome (PECy5) and GPA-PE and sorted into three subpopulations (CD71highGPAlow, CD71highGPAhigh, and CD71lowGPAhigh) as shown in the representative flow cytogram. B, representative morphological images from cytospins slides are shown for the sorted populations that correspond to progressively maturing erythroid precursors. C, RT-QPCR analysis in sorted subpopulations. Two FACS sorting experiments were performed using bone marrow from Caucasian (top panel) or African-American donors (bottom panel), both of whom were Hb AA. Reverse transcription reaction was repeated twice for each RNA sample, followed by QPCRs in triplicate.
FIGURE 4.
FIGURE 4.
KCC expression during in vivo murine erythroid maturation. Fresh low density bone marrow cells from C57/BL6 mice were immunostained with Ter119-PECy7 and CD44-FITC. A, representative flow cytogram indicates sorting gates for four subpopulations (I–IV) that are derived from Ter119+ cells. B, representative morphological images from cytospin slides are shown for corresponding subpopulations. C, summary of cell type composition in corresponding subpopulations by morphological analysis of cytospin images. An average of 150 cells were scored per slide. D, RT-QPCR analysis of murine KCC isoforms in sorted populations. Two FACS sorting experiments were performed, with two reverse transcription reactions for each RNA sample that were followed by two QPCRs in duplicate.
FIGURE 5.
FIGURE 5.
KCC expression in murine erythroleukemia cells during differentiation. MEL cells were induced to differentiate with hexamethylene bisacetamide. A, hemoglobin-expressing cells were detected by histochemical staining with benzidine/hydrogen peroxide solution at indicated days of induction. Representative morphological images from cytospin slides are shown. B, RT-QPCR analysis of mKCC isoforms in induced cells at the indicated days from three independent experiments. The mKCC3 primer/probe set detected both mKCC3a and mKCC3b. Data are shown as mean ± S.D. with two separate RT reactions for each sample, followed by QPCR amplifications in triplicate. C, immunoblot analysis using antibodies against mKCC1, mKCC3, and mKCC4 with anti-actin as loading control.
FIGURE 6.
FIGURE 6.
Physiological characterization of human KCC isoforms expressed in mammalian cells. A, stably transfected HEK293 cells overexpressing different human KCC proteins were maintained in culture with G-418 and grown to 75–90% confluency. Ouabain- and bumetanide-resistant Rb+ influx was measured at 37 °C as described under “Experimental Procedures” in both Cl and sulfamate media under conditions of isotonicity (Iso), treatment with 1 mm N-ethylmaleimide (NEM), or 220 mOsM hypotonic media (Hypo). For each condition, the flux in sulfamate media was subtracted from that in Cl media to give the Cl-dependent flux. B, Rb+ dependence of KCC fluxes. NEM-stimulated, Cl-dependent Rb+ influx is plotted versus external Rb+ concentration. RBC fluxes represent NEM-stimulated, Cl-dependent (ouabain- and bumetanide-resistant) Rb+ influx measured at 37 °C as described previously (12). Double-reciprocal plots (inset) were linear and yielded values for Km (mm) shown in the table at right (n = 3). Curves depicted were drawn from the resultant Michaelis-Menten equations. C, anion dependence of KCC fluxes. NEM-stimulated fluxes were measured in isotonic solutions containing various anions. Note different scales. Fluxes higher than those in sulfamate media, indicated by dashed line, reflect KCC-mediated fluxes supported by the indicated anion. Data are shown as mean ± S.D. of three independent experiments. *, p = 0.05; **, p < 0.01. D, KCC activity (NEM-stimulated, Cl-dependent Rb+ influx) in HEK293 cells coexpressing KCC3 with KCC1 constructs, either N-truncated KCC1Δ117 (upper panel) or full-length KCC1 (lower panel). KCC3a DNA was inserted into a tetracycline-inducible vector integrated into the FlipIn T-REX HEK293 cell line (see “Experimental Procedures”). This KCC3 cell line was then transfected with an SF91-eGFP-PRE vector encoding KCC1Δ117 or full-length KCC1. Control cells were transfected with empty SF91-eGFP-PRE vector. Cells labeled None had empty vector and no induction. KCC1 (or KCC1Δ117) cells were not induced and thus expressed KCC1 (KCC1Δ117) alone. KCC3 cells were transduced with empty vector (no KCC1 or KCC1Δ117 expression) and subsequently induced for 48 h with 1 ng/ml doxycycline prior to flux assay. Cells labeled Both expressed both KCC3+ and KCC1 (or KCC1Δ117) constructs (transduced with KCC1/KCC1Δ117 vector and induced with tetracycline). Bars represent mean ± S.D. of six experiments for KCC1 and three experiments for KCC1Δ117. Paired t test: *, p < 0.006; **, p < 0.001.

Similar articles

Cited by

References

    1. Gamba G. (2005) Physiol. Rev. 85, 423–493 - PubMed
    1. Gillen C. M., Brill S., Payne J. A., Forbush B., 3rd (1996) J. Biol. Chem. 271, 16237–16244 - PubMed
    1. Payne J. A., Stevenson T. J., Donaldson L. F. (1996) J. Biol. Chem. 271, 16245–16252 - PubMed
    1. Hiki K., D'Andrea R. J., Furze J., Crawford J., Woollatt E., Sutherland G. R., Vadas M. A., Gamble J. R. (1999) J. Biol. Chem. 274, 10661–10667 - PubMed
    1. Mount D. B., Mercado A., Song L., Xu J., George A. L., Jr., Delpire E., Gamba G. (1999) J. Biol. Chem. 274, 16355–16362 - PubMed

Publication types

LinkOut - more resources