. 2012 Feb 7;279(1728):444-50.
doi: 10.1098/rspb.2011.0913. Epub 2011 Jul 6.

Unravelling transmission trees of infectious diseases by combining genetic and epidemiological data

Affiliations

Unravelling transmission trees of infectious diseases by combining genetic and epidemiological data

R J F Ypma et al. Proc Biol Sci. .

Abstract

Knowledge on the transmission tree of an epidemic can provide valuable insights into disease dynamics. The transmission tree can be reconstructed by analysing either detailed epidemiological data (e.g. contact tracing) or, if sufficient genetic diversity accumulates over the course of the epidemic, genetic data of the pathogen. We present a likelihood-based framework to integrate these two data types, estimating probabilities of infection by taking weighted averages over the set of possible transmission trees. We test the approach by applying it to temporal, geographical and genetic data on the 241 poultry farms infected in an epidemic of avian influenza A (H7N7) in The Netherlands in 2003. We show that the combined approach estimates the transmission tree with higher correctness and resolution than analyses based on genetic or epidemiological data alone. Furthermore, the estimated tree reveals the relative infectiousness of farms of different types and sizes.


Figures
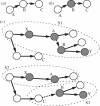
Figure 1.
Figure 1.
Examples of transmission trees. Circles denote farms, full arrows denote estimated infections, dotted arrows denote possible infections. Filled circles denote farms from which no sequence data were available. (a) When all data are available, the probability that B infected C is proportional to the likelihood L(δBC) given in equation (2.1). (b) When genetic data are missing for B, we can infer this by looking at the sequence of the farm A that infected B. We then assess the likelihood for the whole subtree: A infecting B, infecting C. (c) When genetic data are missing for multiple farms, we look at the subtrees containing those farms. Here, two transmission trees are possible; B is infected by either A or C. The likelihood that A infected B is proportional to the likelihood of S1, while the likelihood that C infected B is proportional to the product of the likelihoods of S2 and S3.
Figure 2.
Figure 2.
Infection events with posterior probability greater than 0.5. The analysis was run separately three times using (a) temporal, genetic and geographical, (b) temporal and genetic or (c) temporal and geographical data. Red dots denote infected farms, yellow dots denote farms not infected in the epidemic. A higher arrows opacity corresponds to a higher estimated probability. The lack of arrows in (c) tells us geographical information alone is not enough to establish transmission links. Although genetic information yields quite accurate results, we obtain more certainty for many links when also incorporating the geographical data. Furthermore, in the combined analysis, we can correctly show there was only one introduction into the southern province of The Netherlands rather than multiple as suggested by the genetic data (indicated by the red arrows). A magnified version of the northern part of the outbreak is given in the electronic supplementary material, figure S1.
Figure 3.
Figure 3.
Resolution of the estimated trees. For each level of probability, the percentage of farms for which the farm that infected it can be estimated at or above this level is plotted. Estimates are based on temporal and (blue) genetic, (red) geographical or (black) both data. Dashed and dotted lines give the same information for sequenced and unsequenced farms, respectively. The graph for genetic data (blue) is much higher than that for the geographical data (red), which shows the former yields more resolution than the latter. This is confirmed by the fact that unsequenced farms are hard to place accurately in the transmission tree, resulting in a small surface under the dotted lines. However, combination of all data types results in the highest resolution, shown by the largest surface being under the black line.
Figure 4.
Figure 4.
Scatterplot illustrating the position of unsequenced farms in the estimated tree. For each sequenced farm, we plot the minimum of the genetic distances to the sequenced farms infected earlier than this farm (horizontal axis) against the probability it was infected by an unsequenced farm (vertical axis). The small horizontal lines give the average probability per distance, the large horizontal line gives the fraction of unsequenced farms (equal to 0.23). The increasing trend shows that the placement of unsequenced farms in the estimated tree is more likely to be between farms whose genetic distance is relatively large. This is probably owing to large genetic distances being indicative of farms in the actual transmission tree not being sequenced.
Figure 5.
Figure 5.
Estimated average infectiousness for (a) different types of farms and (b) number of animals on the farm, as measured by number of infections caused divided by the time period in days between infection and culling of the farm. All farms to the left of the dashed line in (b) are hobby farms by definition (these are farms with less than 300 animals). (a) We see hobby farms are less infectious than other types of farms, while turkey farms are more infectious than chicken farms. This can possibly be explained by the fact that many of the turkey farms in the epidemic were among the first to be infected when the disease spread to the southern part of the country, where control measures were not yet in place. (b) There is a correlation between total animals present on a farm and their infectiousness, however, the exact relationship remains unclear.

References

    1. Keeling M. J., Woolhouse M. E., May R. M., Davies G., Grenfell B. T. 2003. Modelling vaccination strategies against foot-and-mouth disease. Nature 421, 136–14210.1038/nature01343 (doi:10.1038/nature01343) - DOI - DOI - PubMed
    1. Ferguson N. M., Donnelly C. A., Anderson R. M. 2001. Transmission intensity and impact of control policies on the foot and mouth epidemic in Great Britain. Nature 413, 542–54810.1038/35097116 (doi:10.1038/35097116) - DOI - DOI - PubMed
    1. Heijne J. C., Teunis P., Morroy G., Wijkmans C., Oostveen S., Duizer E., Kretzschmar M., Wallinga J. 2009. Enhanced hygiene measures and norovirus transmission during an outbreak. Emerg. Infect. Dis. 15, 24–3010.3201/1501.080299 (doi:10.3201/1501.080299) - DOI - DOI - PMC - PubMed
    1. Wallinga J., Teunis P. 2004. Different epidemic curves for severe acute respiratory syndrome reveal similar impacts of control measures. Am. J. Epidemiol. 160, 509–51610.1093/aje/kwh255 (doi:10.1093/aje/kwh255) - DOI - DOI - PMC - PubMed
    1. Lloyd-Smith J. O., Schreiber S. J., Kopp P. E., Getz W. M. 2005. Superspreading and the effect of individual variation on disease emergence. Nature 438, 355–35910.1038/nature04153 (doi:10.1038/nature04153) - DOI - DOI - PMC - PubMed

MeSH terms