. 2011 Aug;60(8):2134-43.
doi: 10.2337/db10-1411. Epub 2011 Jul 6.

High-fat diet-induced adipocyte cell death occurs through a cyclophilin D intrinsic signaling pathway independent of adipose tissue inflammation

Affiliations

High-fat diet-induced adipocyte cell death occurs through a cyclophilin D intrinsic signaling pathway independent of adipose tissue inflammation

Daorong Feng et al. Diabetes. 2011 Aug.

Abstract

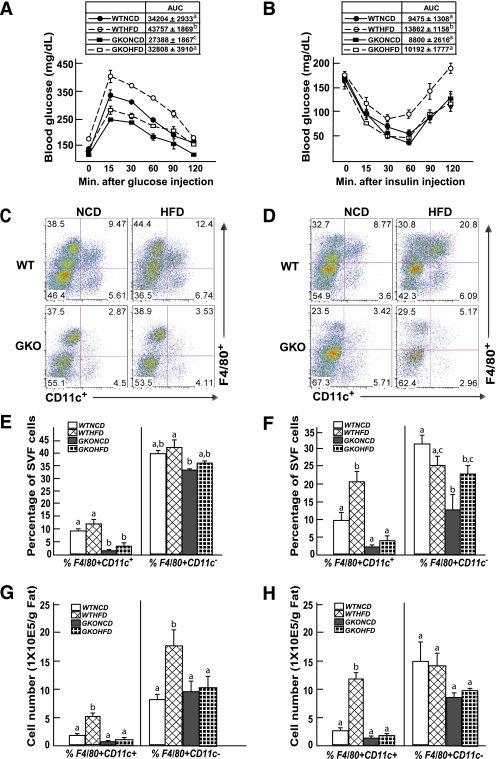
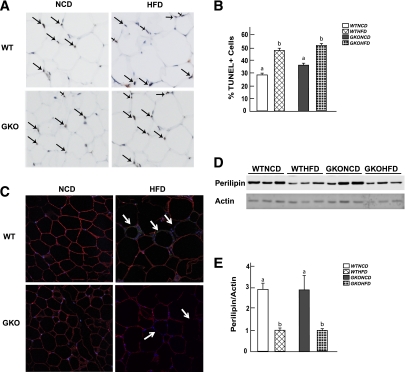
Objective: Previous studies have demonstrated that mice fed a high-fat diet (HFD) develop insulin resistance with proinflammatory macrophage infiltration into white adipose tissue. Concomitantly, adipocytes undergo programmed cell death with the loss of the adipocyte-specific lipid droplet protein perilipin, and the dead/dying adipocytes are surrounded by macrophages that are organized into crown-like structures. This study investigated whether adipocyte cell death provides the driving signal for macrophage inflammation or if inflammation induces adipocyte cell death.

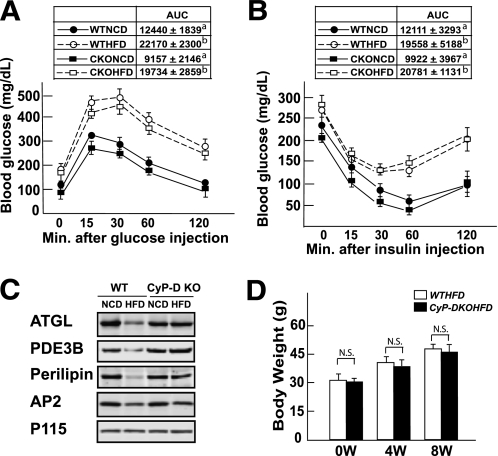
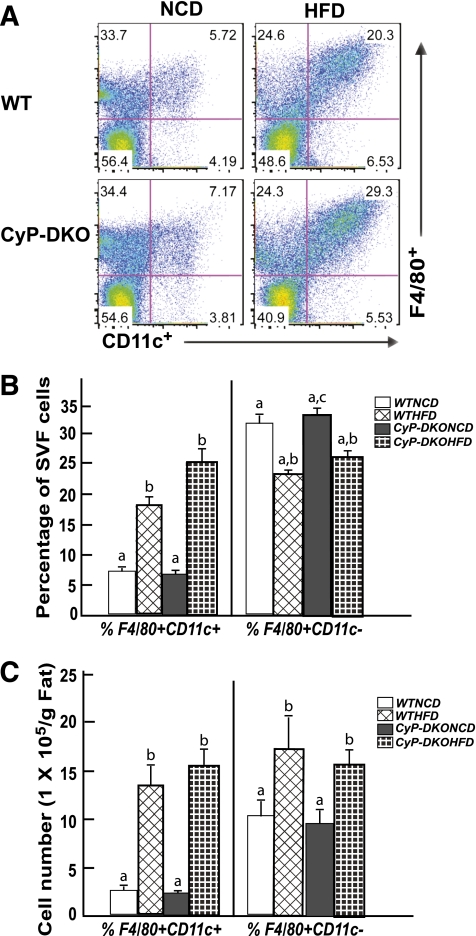
Research design and methods: Two knockout mouse models were used: granulocyte/monocyte-colony stimulating factor (GM-CSF)-null mice that are protected against HFD-induced adipose tissue inflammation and cyclophilin D (CyP-D)-null mice that are protected against adipocyte cell death. Mice were fed for 4-14 weeks with a 60% HFD, and different markers of cell death and inflammation were analyzed.

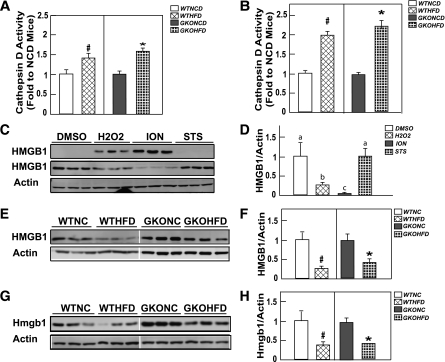
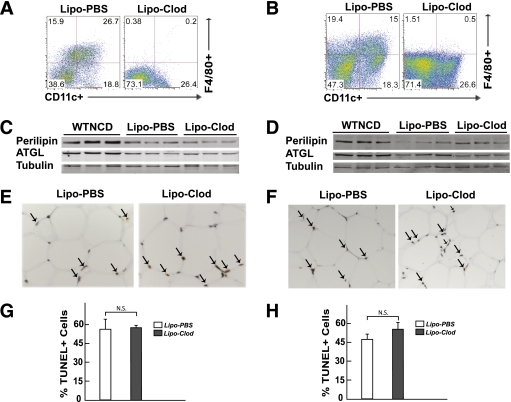
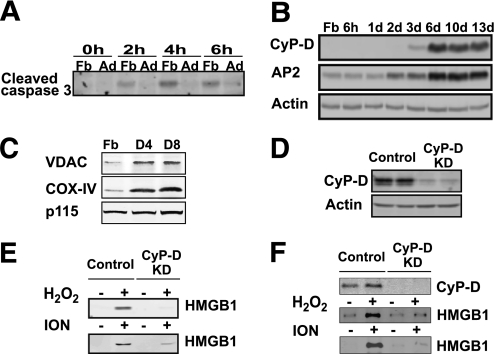
Results: HFD induced a normal extent of adipocyte cell death in GM-CSF-null mice, despite a marked reduction in adipose tissue inflammation. Similarly, depletion of macrophages by clodronate treatment prevented HFD-induced adipose tissue inflammation without any affect on adipocyte cell death. However, CyP-D deficiency strongly protected adipocytes from HFD-induced cell death, without affecting adipose tissue inflammation.

Conclusions: These data demonstrate that HFD-induced adipocyte cell death is an intrinsic cellular response that is CyP-D dependent but is independent of macrophage infiltration/activation.


Figures

FIG. 1.
FIG. 1.
GM-CSF–null mice are protected against HFD-induced glucose and insulin intolerance and against HFD-induced adipose tissue macrophage infiltration. Wild-type and GM-CSF–null 9-week-old male mice were fed NCD or HFD for 4 weeks, were fasted for 16 h (IPGTT) or 4 h (ITT), and blood was drawn for determination of fasting glucose and insulin levels. The mice were given an intraperitoneal injection of 1 g/kg glucose (A) or 1 unit/kg insulin (B), and blood glucose and insulin levels were determined at 15, 30, 60, 90, and 120 min. WTHFD, wild-type mice fed the HFD; WTNCD, wild-type mice fed the NCD; GKOHFD, GM-CSF–null mice fed the HFD; GKONCD, GM-CSF–null mice fed the NCD. Area under the curve (AUC) for each condition (n = 4 mice per group) is shown in the insert. Identical letters indicate values that are not statistically different from each other (P > 0.05). Wild-type and GM-CSF–null 9-week-old male mice were fed the NCD or HFD for 4 (C, E, G) or 8 (D, F, H) weeks. The stromal vascular fraction from an entire epididymal adipose tissue fat pad was isolated and subjected to flow cytometry analysis after labeling with F4/80 and CD11c antibodies, as described in research design and methods (C, D). The data obtained from three to five independent experiments were calculated for the percentage of F4/80+CD11c+ and F4/80+CD11c (E, F) and the total number of F4/80+CD11c+ and F4/80+CD11c cells (G, H). Data were analyzed as described in statistical analysis and are shown as the mean ± standard error of the mean. Identical letters indicate values that are not statistically different from each other (P > 0.05). (A high-quality digital representation of this figure is available in the online issue.)
FIG. 2.
FIG. 2.
TUNEL-positive cells increased in fixed epididymal tissue after 14 weeks of an HFD in wild-type and GM-CSF–null adipose tissue. Adipose tissue from wild-type and GM-CSF–null mice fed an NCD or HFD for 14 weeks was fixed and subjected to TUNEL staining. A: Dark brown nuclei are TUNEL-positive cells, and light blue is normal nuclei staining. B: Quantitated TUNEL-positive cells. Data shown are the mean ± standard error of the mean for three to six mice per group, with 200–500 nuclei per counted per individual mouse section. Identical letters indicate values that are not statistically different from each other (P > 0.05). C: Adipose tissue was subjected to immunofluorescence microscopy for perilipin expression using a secondary red antibody, F4/80 expression using a secondary green antibody, and nuclei by DAPI staining (blue). The white arrows indicate the cells with loss of perilipin expression. D: Adipose tissue (from three independent mice per condition) was extracted and immunoblotted for perilipin and actin. E: Laser scanning densitometry of the immunoblots was used to quantify the ratio of perilipin expression normalized for actin. Data shown are the mean ± standard error of the mean for four to six mice per group. Identical letters indicate values that are not statistically different from each other (P > 0.05). WTHFD, wild-type mice fed the HFD; WTNCD, wild-type mice fed the NCD; GKOHFD, GM-CSF–null mice fed the HFD; GKONCD, GM-CSF–null mice fed the NCD. (A high-quality digital representation of this figure is available in the online issue.)
FIG. 3.
FIG. 3.
Wild-type and GM-CSF mice fed the HFD display a similar increase in adipose tissue extract cathepsin D activity and HMGB1 release. Wild-type and GM-CSF–null male mice at 9 weeks of age were fed NCD or HFD for 4 (A) or 8 (B) weeks. Adipose tissue extracts from an entire epididymal adipose tissue fat pad were prepared and assayed for cathepsin D activity, as described in research design and methods. Cathepsin D activity of the HFD adipose tissue extracts was normalized to their respective NCD adipose tissue extracts. Data shown are the mean ± standard error of the mean for three to seven mice per group. C and D: 3T3-L1 cells were differentiated for 12 days to generate fully differentiated adipocytes as described in research design and methods. The cells were then treated for 1 h with vehicle (DMSO), 500 μmol/L H2O2, 2 μmol/L ION, or 1 μmol/L STS in serum-free DMEM medium. Then, 30 μL of the culture medium was immunoblotted for HMGB1 (upper panel). The cultured adipocytes were extracted, and 20 μg of protein was immunoblotted for HMBG1 and β-actin as a loading control. This is a representative immunoblot performed in triplicate. E–H: Wild-type and GM-CSF–null male 9-week-old mice were fed the NCD or HFD for 4 (E, F) or 8 (G and H) weeks. Adipose tissue extracts from an entire epididymal adipose tissue fat pad were prepared and immunoblotted for the presence of HMGB1 and actin as a loading control. These are representative immunoblots from three independent animals for each group. The right panels show densitometric quantification of the relative HMBG1/actin levels. For comparison, the ratios from the NCD mice were normalized to 1.0. Data shown are the mean ± standard error of the mean for three to five mice per group. In panels B, F, and H, the # and * symbols indicate statistical significance (P < 0.05) by Student t test. Data shown in panel D were analyzed as described in statistical analysis. Identical letters indicate values that are not statistically different from each other (P > 0.05).
FIG. 4.
FIG. 4.
Macrophage depletion by liposome clodronate had no effect on HFD-induced adipocyte cell death. Wild-type mice fed an NCD (WTNCD) were then fed an HFD and concomitantly injected weekly with liposome PBS or liposome clodronate for 8 weeks (A, C, E, G). Mice fed an HFD for 8 weeks were injected weekly with liposome PBS or liposome clodronate for an additional 7 weeks (B, D, F, H). These mice were continually maintained on the HFD. A and B: Representative FACS analyses of the stromal vascular fraction (SVF) isolated from epididymal adipose tissue from a total of four to seven independent determinations. C and D: Adipose tissue from three independent mice was extracted and immunoblotted for perilipin, ATGL, and actin. E and F: A representative TUNEL staining section shows positive nuclei (arrows). G and H: Quantification of TUNEL-positive cells are mean ± standard error of the mean for four to seven mice per group with 200–500 nuclei per counted per individual mouse section. N.S. as determined by Student t test. (A high-quality digital representation of this figure is available in the online issue.)
FIG. 5.
FIG. 5.
Differentiated 3T3-L1 adipocytes are sensitive to CyP-D–dependent necrotic cell death. A: 3T3-L1 fibroblasts (Fb) and differentiated 3T3-L1 adipocytes (Ad) were treated with 1 μmol/L STS for the time indicated. The formation of proteolytic processed caspase 3 was detected by immunoblotting with a cleaved caspase 3–specific antibody. B: Cell extracts were prepared from 3T3-L1 fibroblasts and at different times after induction of 3T3-L1 adipogenesis. The induction of CyP-D protein was determined by immunoblotting and compared with the induction of the aP2 protein and actin as a loading control. C: Cell extracts were prepared from 3T3-L1 Fbs and after 4 (D4) and 8 (D8) days of adipocyte differentiation. The extracts were immunoblotted for the VDAC, COX-IV, and the p115 protein as a loading control. D: Cell extracts were prepared from differentiated 3T3-L1 adipocytes that were infected with a control lentivirus (MISSION control vector, two representative cell lines) and from cells infected with shRNA directed against CyP-D (clones of 638 and 710, two representative cell lines). Total cell extracts were immunoblotted for CyP-D and β-actin as a loading control. E: Control and CyP-D–knockdown (KD) cells were differentiated for 8 days and incubated for 24 h in the absence of serum. The cells were then treated with and without H2O2 (30 mmol/L) or ION (2 μmol/L) for 4 h. Cell extracts were prepared and immunoblotted for the presence of HMGB1 released into the cell medium. F: Control and CyP-D–knockdown cells were differentiated for 8 days and incubated with and without and H2O2 (30 mmol/L) or ION (2 μmol/L) for 4 h in the presence of 10% FCS. Cell extracts were prepared and immunoblotted for CyP-D and for the presence of HMGB1 released into the cell medium.
FIG. 6.
FIG. 6.
CyP-D mice are protected against HFD-induced adipocyte cell death but display glucose intolerance and insulin resistance. Wild-type and CyP-D–null 9-week-old male mice were fed an NCD or HFD for 9 weeks and then fasted for 16 h (IPGTT) or 5 h (ITT), and blood was drawn for determination of fasting glucose and insulin levels. The mice were given an intraperitoneal injection of 1 g/kg glucose (A) or 1 unit/kg insulin (B), and blood glucose and insulin levels were determined at 15, 30, 60 and 120 min. WTNCD, wild-type mice fed the NCD; WTHFD, wild-type mice fed the HFD; CKONCD, CyP-D–null mice fed the NCD; CKOHFD, CyP-D–null mice fed the HFD. Area under the curve (AUC) for each condition is shown in the insert. Data were analyzed as described in statistical analysis. Identical letters indicate values that are not statistically different from each other (P > 0.05). C: Adipose tissue extracts were prepared from wild-type and CyP-D–null mice fed an NCD or HFD as described and immunoblotted for ATGL, PDE3B, perilipin, the aP2 fatty acid binding protein, and the p115 Golgi protein as a loading control. D: Average body weight of 6 wild-type and CyP-D–null mice fed an HFD for 0, 4, and 8 weeks.
FIG. 7.
FIG. 7.
CyP-D–null (KO) mice display a normal extent of HFD-induced macrophage infiltration into adipose tissue. Wild-type and CyP-D–null 9-week-old male mice were fed the NCD or HFD for 12 weeks. The stromal vascular fraction (SVF) from an entire epididymal adipose tissue fat pad was isolated and subjected to flow cytometry analysis after labeling with F4/80 and CD11c antibodies as described in research design and methods. FACS analysis of SVF isolated from epididymal adipose tissue. B: Percentage of F4/80+CD11c+ and F4/80+CD11c macrophages in SVF of epididymal adipose tissue. C: Total number of F4/80+CD11c+ and F480+CD11c cells. Data shown are the mean ± standard error of the mean six mice per group and were analyzed as described in statistical analysis. Identical letters indicate values that are not statistically different from each other (P > 0.05).

References

    1. Xu H, Barnes GT, Yang Q, et al. Chronic inflammation in fat plays a crucial role in the development of obesity-related insulin resistance. J Clin Invest 2003;112:1821–1830 - PMC - PubMed
    1. Elgazar-Carmon V, Rudich A, Hadad N, Levy R. Neutrophils transiently infiltrate intra-abdominal fat early in the course of high-fat feeding. J Lipid Res 2008;49:1894–1903 - PubMed
    1. Liu J, Divoux A, Sun J, et al. Genetic deficiency and pharmacological stabilization of mast cells reduce diet-induced obesity and diabetes in mice. Nat Med 2009;15:940–945 - PMC - PubMed
    1. Winer S, Chan Y, Paltser G, et al. Normalization of obesity-associated insulin resistance through immunotherapy. Nat Med 2009;15:921–929 - PMC - PubMed
    1. Nishimura S, Manabe I, Nagasaki M, et al. CD8+ effector T cells contribute to macrophage recruitment and adipose tissue inflammation in obesity. Nat Med 2009;15:914–920 - PubMed

Publication types

MeSH terms