

Hydrogen sulfide augments synaptic neurotransmission in the nucleus of the solitary tract
- PMID: 21734104
- PMCID: PMC3191839
- DOI: 10.1152/jn.00463.2011
Hydrogen sulfide augments synaptic neurotransmission in the nucleus of the solitary tract
Abstract
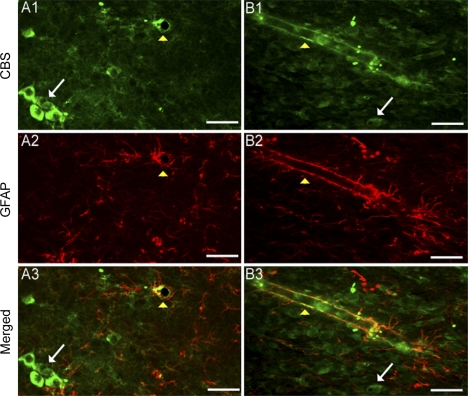
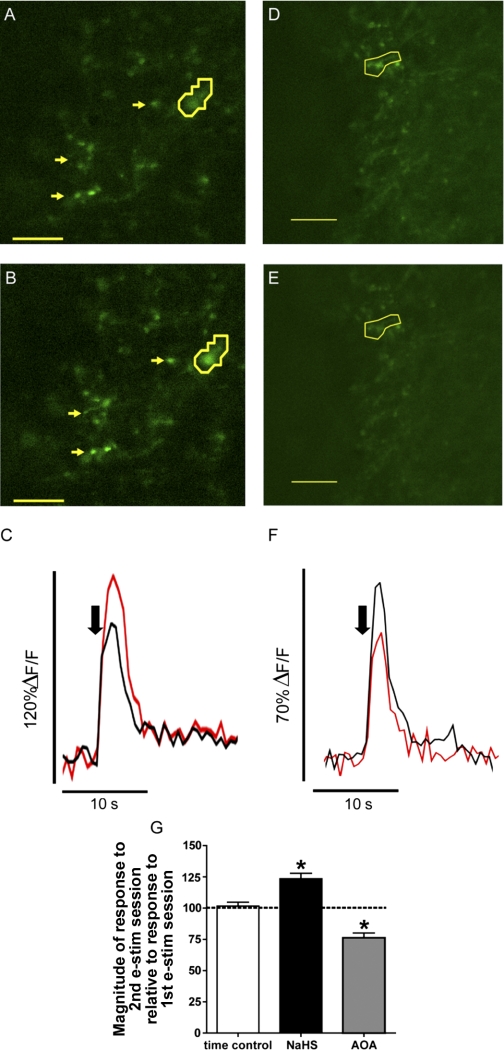
Within the brain stem, the nucleus tractus solitarii (NTS) serves as a principal central site for sensory afferent integration from the cardiovascular and respiratory reflexes. Neuronal activity and synaptic transmission in the NTS are highly pliable and subject to neuromodulation. In the central nervous system, hydrogen sulfide (H₂S) is a gasotransmitter generated primarily by the enzyme cystathionine-β-synthase (CBS). We sought to determine the role of H₂S, and its generation by CBS, in NTS excitability. Real-time RT-PCR, immunoblot, and immunohistochemistry analysis identified the presence of CBS in the NTS. Patch-clamp electrophysiology in brain stem slices examined excitatory postsynaptic currents (EPSCs) and membrane properties in monosynaptically driven NTS neurons. Confocal imaging of labeled afferent synaptic terminals in NTS slices monitored intracellular calcium. Exogenous H₂S significantly increased the amplitude of evoked solitary tract (TS)-EPSCs, frequency of miniature (m)EPSCs, and presynaptic terminal calcium fluorescence in the NTS. H₂S did not alter action potential discharge or postsynaptic properties. On the other hand, the CBS inhibitor aminooxyacetate (AOA) significantly reduced the amplitude of TS-EPSCs and presynaptic terminal calcium fluorescence in the NTS without altering postsynaptic properties. Taken together, these data support a presynaptic role for endogenous H₂S in modulation of excitatory neurotransmission in the NTS.
Figures


Similar articles
-
Dopamine modulates synaptic transmission in the nucleus of the solitary tract.J Neurophysiol. 2002 Nov;88(5):2736-44. doi: 10.1152/jn.00224.2002. J Neurophysiol. 2002. PMID: 12424308
-
Depressed GABA and glutamate synaptic signaling by 5-HT1A receptors in the nucleus tractus solitarii and their role in cardiorespiratory function.J Neurophysiol. 2014 Jun 15;111(12):2493-504. doi: 10.1152/jn.00764.2013. Epub 2014 Mar 26. J Neurophysiol. 2014. PMID: 24671532 Free PMC article.
-
Synaptic transmission in nucleus tractus solitarius is depressed by Group II and III but not Group I presynaptic metabotropic glutamate receptors in rats.J Physiol. 2002 Feb 1;538(Pt 3):773-86. doi: 10.1113/jphysiol.2001.012948. J Physiol. 2002. PMID: 11826164 Free PMC article.
-
Plasticity in glutamatergic NTS neurotransmission.Respir Physiol Neurobiol. 2008 Dec 10;164(1-2):105-11. doi: 10.1016/j.resp.2008.04.013. Respir Physiol Neurobiol. 2008. PMID: 18524694 Free PMC article. Review.
-
Astrocytes in the nucleus of the solitary tract: Contributions to neural circuits controlling physiology.Physiol Behav. 2020 Sep 1;223:112982. doi: 10.1016/j.physbeh.2020.112982. Epub 2020 Jun 11. Physiol Behav. 2020. PMID: 32535136 Free PMC article. Review.
Cited by
-
H2S-based fluorescent imaging for pathophysiological processes.Front Chem. 2023 Jan 27;11:1126309. doi: 10.3389/fchem.2023.1126309. eCollection 2023. Front Chem. 2023. PMID: 36778034 Free PMC article. Review.
-
Proposed toxic and hypoxic impairment of a brainstem locus in autism.Int J Environ Res Public Health. 2013 Dec 11;10(12):6955-7000. doi: 10.3390/ijerph10126955. Int J Environ Res Public Health. 2013. PMID: 24336025 Free PMC article.
-
Role of thiosulfate in hydrogen sulfide-dependent redox signaling in endothelial cells.Am J Physiol Heart Circ Physiol. 2017 Aug 1;313(2):H256-H264. doi: 10.1152/ajpheart.00723.2016. Epub 2017 May 26. Am J Physiol Heart Circ Physiol. 2017. PMID: 28550177 Free PMC article.
-
5-hydroxytryptamine 2C receptors tonically augment synaptic currents in the nucleus tractus solitarii.J Neurophysiol. 2012 Oct;108(8):2292-305. doi: 10.1152/jn.00049.2012. Epub 2012 Aug 1. J Neurophysiol. 2012. PMID: 22855775 Free PMC article.
-
Hydrogen sulfide inhibits Kir2 and Kir3 channels by decreasing sensitivity to the phospholipid phosphatidylinositol 4,5-bisphosphate (PIP2).J Biol Chem. 2018 Mar 9;293(10):3546-3561. doi: 10.1074/jbc.RA117.001679. Epub 2018 Jan 9. J Biol Chem. 2018. PMID: 29317494 Free PMC article.
References
-
- Andresen M. Cardiovascular integration in the nucleus of the solitary tract. In: Neural Mechanisms of Cardiovascular Regulation, edited by Dun N, Machado B, Pilowsky P. Boston, MA: Kluwer, 2004, p. 59–80
-
- Andresen M, Kunze D. Nucleus tractus solitarius—gateway to neural circulatory control. Annu Rev Physiol 56: 93–116, 1994 - PubMed
-
- Andresen M, Mendelowitz D. Sensory afferent neurotransmission in caudal nucleus tractus solitarius—common denominators. Chem Senses 21: 387–395, 1996 - PubMed
Publication types
MeSH terms
Substances
Grants and funding
LinkOut - more resources
Full Text Sources