. 2011 Aug 25;118(8):2254-65.
doi: 10.1182/blood-2010-12-325753. Epub 2011 Jul 6.

A human promyelocytic-like population is responsible for the immune suppression mediated by myeloid-derived suppressor cells

Affiliations

A human promyelocytic-like population is responsible for the immune suppression mediated by myeloid-derived suppressor cells

Samantha Solito et al. Blood. .

Abstract

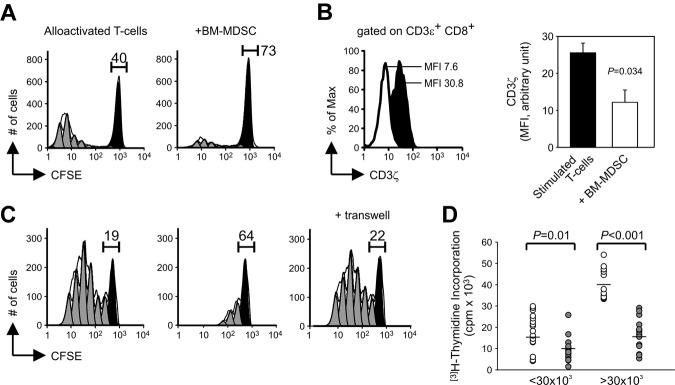
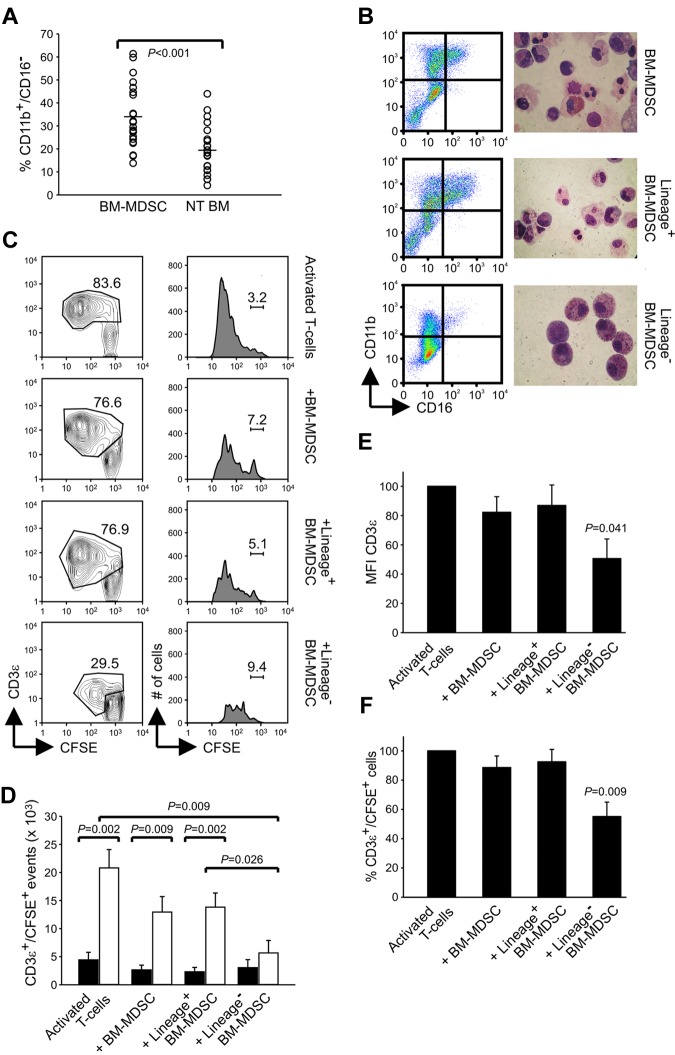
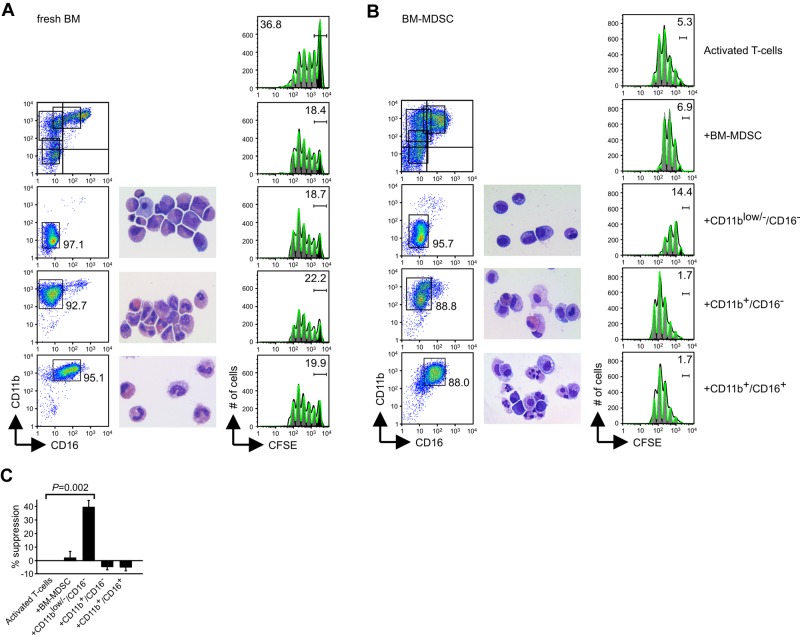
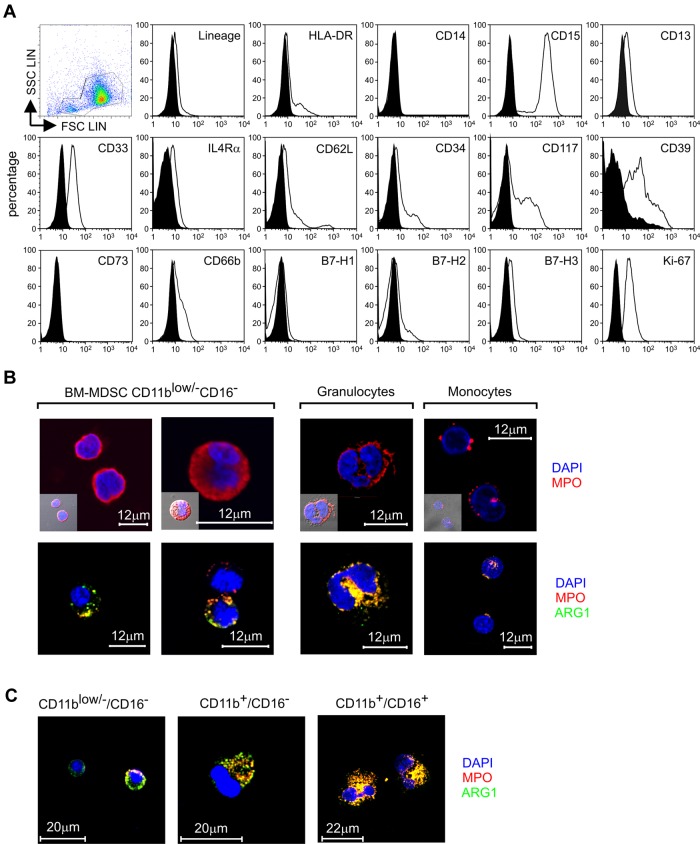
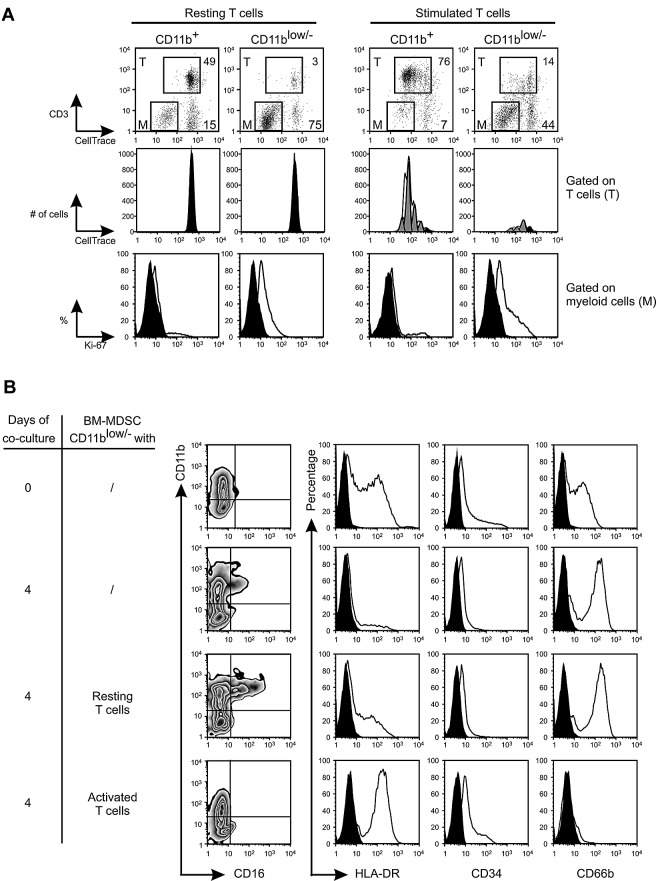
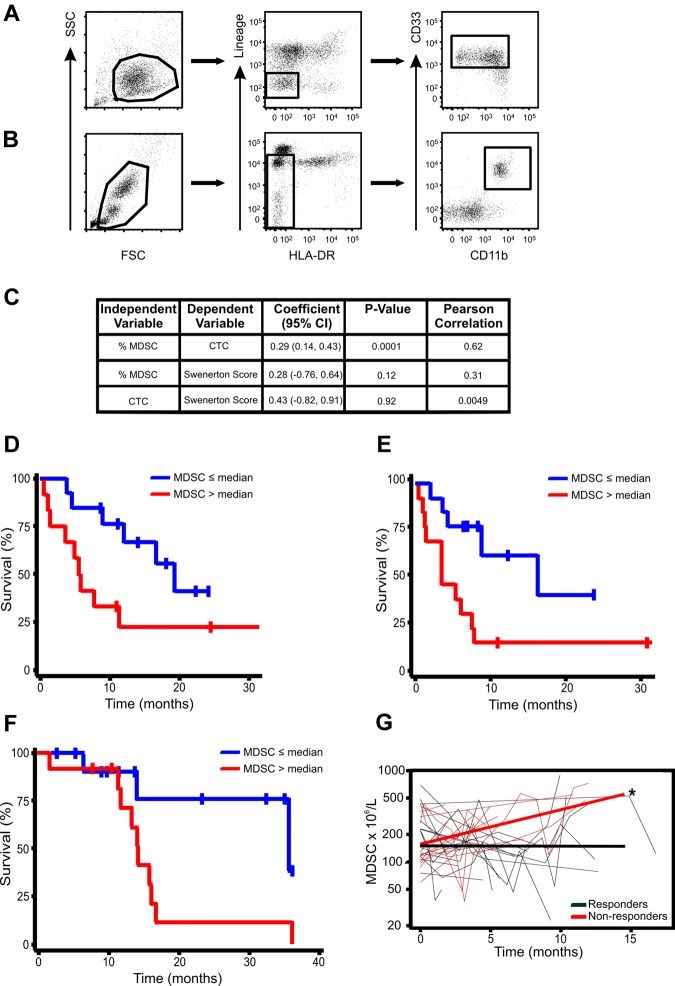
We recently demonstrated that human BM cells can be treated in vitro with defined growth factors to induce the rapid generation of myeloid-derived suppressor cells (MDSCs), hereafter defined as BM-MDSCs. Indeed, combination of G-CSF + GM-CSF led to the development of a heterogeneous mixture of immature myeloid cells ranging from myeloblasts to band cells that were able to suppress alloantigen- and mitogen-stimulated T lymphocytes. Here, we further investigate the mechanism of suppression and define the cell subset that is fully responsible for BM-MDSC-mediated immune suppression. This population, which displays the structure and markers of promyelocytes, is however distinct from physiologic promyelocytes that, instead, are devoid of immuosuppressive function. In addition, we demonstrate that promyelocyte-like cells proliferate in the presence of activated lymphocytes and that, when these cells exert suppressive activity, they do not differentiate but rather maintain their immature phenotype. Finally, we show that promyelocyte-like BM-MDSCs are equivalent to MDSCs present in the blood of patients with breast cancer and patients with colorectal cancer and that increased circulating levels of these immunosuppressive myeloid cells correlate with worse prognosis and radiographic progression.


Figures

Figure 1
Figure 1
Characterization of BM-MDSC–mediated immune suppression. (A) CFSE-labeled PBMCs were stimulated with allogeneic γ-irradiated PBMCs without (left) or with (right) γ-irradiated BM-MDSCs added at a ratio of 1:1. After 7 days, cell cultures were harvested, labeled with anti-CD3ϵ, and analyzed in the CD3ϵ+/CFSE+ cell gate. The figure shows a representative experiment of cell division analysis of 3 performed. The percentages of the undivided cells are indicated. (B) After 7 days of culture, cultures set up as in panel A were labeled with anti-CD3ϵ, anti-CD8, fixed, and then labeled with anti-CD3ζ. Mean fluorescence intensity (MFI) of CD3ζ was calculated in the CFSE+/CD3ϵ+/CD8+ cell gate. On the left panel, black histogram represents the MFI of stimulated PBMCs without BM-MDSCs, whereas the white histogram refers to MFI of stimulated PBMCs in presence of γ-irradiated BM-MDSCs. On the right panel, MFI values of CD3ζ are presented as mean ± SE of 3 independent experiments; P = .034, Student t test. (C) PBMCs were labeled with CFSE and stimulated with coated anti-CD3 and soluble anti-CD28 (left) and cocultured with BM-MDSCs in the presence (right) or in the absence (center) of a transwell. After 4 days, cells were harvested, labeled with anti-CD3ϵ, and analyzed in the CD3ϵ+/CFSE+ gate. The figure shows a representative experiment of 3. The percentages of the undivided cells are indicated. (D) Proliferation of alloactivated PBMCs cocultured either with or without γ-irradiated BM-MDSCs was assessed by 3H-thymidine incorporation. White dots represent the proliferation of stimulated PBMCs without BM-MDSCs, and gray dots correspond to the proliferation of alloactivated PBMCs in presence of BM-MDSCs. Twenty independent experiments are shown with proliferation of alloactivated PBMCs < 30 × 103 cpm (columns 1 and 2) and 15 experiments with proliferation > 30 × 103 cpm (columns 3 and 4). P = .01 and P < .001, Mann-Whitney U test.
Figure 2
Figure 2
Lin subset contained within BM-MDSCs shows potent suppressive activity. (A) Flow cytometric analysis of BM cells cultured for 4 days with G-CSF + GM-CSF (BM-MDSCs) or without growth factors (NT BM). At the end of the culture, cells were harvested and labeled, and the percentages of CD11b+/CD16 cells were calculated. The figure represents 22 independent experiments; P ≤ .001, Student t test. (B) Flow cytometric profile of CD16 and CD11b expression and May-Grünwald-Giemsa staining on BM-MDSCs before and after immunomagnetic depletion with Lin Ab cocktail. (C) Flow cytometric analysis of the proliferation of allogenic PBMCs, stained with CFSE and activated with anti-CD3 and anti-CD28 for 4 days, in the presence of either BM-MDSCs or the fractions Lin+ or Lin sorted from BM-MDSCs. The figure, in which the percentages of undivided CD3ϵ+/CFSE+ lymphocytes are shown, represents 1 of 3 independent experiments. (D) Number of CD3ϵ+/CFSE+ events obtained after activation of PBMCs with anti-CD3/CD28 and cocultured in the presence of BM-MDSCs or the subsets Lin+ and Lin sorted from BM-MDSCs. The figure, in which the black bars refer to undivided cells and the gray bars to divided cells, represent the mean ± SE of 6 independent experiments. The values of P are indicated in the figure, Mann-Whitney U test. (E-F) Evaluation of MFI of CD3ϵ chain expression and percentage of the CD3ϵ+/CFSE+ cells in PBMCs stimulated with anti-CD3/CD28 in the presence of BM-MDSCs or the Lin+ and Lin fractions. Values are mean ± SE of 6 independent experiments. All comparisons among BM-MDSCs containing cultures versus cultures without BM-MDSCs, P = .041 (E) and P = .009 (F), respectively, Mann-Whitney U test.
Figure 3
Figure 3
CD11blow/−/CD16 phenotype defines the subset responsible for the immune suppression in BM-MDSCs. (A) Flow cytometric evaluation of CD11b and CD16 markers in BM-MDSC or sorted CD11blow/−/CD16, CD11b+/CD16 and CD11b+/CD16+ cell populations from fresh BM samples (left), structural analysis by May-Grünwald-Giemsa staining (center), and CFSE dilution proliferation assay (right) in which values reported on histograms represent the percentages of cells in the parental, undivided generation. (B) Flow cytometric evaluation of CD11b and CD16 markers in BM-MDSCs or sorted CD11blow/−/CD16, CD11b+/CD16, and CD11b+/CD16+ cell populations from BM-MDSCs (left), structural analysis by May-Grünwald-Giemsa staining (center), and CFSE dilution proliferation assay (right) in which values reported on histograms represent the percentages of cells in the parental, undivided generation. (C) Suppression of allogenic CFSE+ PBMCs activated with anti-CD3 and anti-CD28 and cocultured in the presence of 1:1 ratio of the different populations sorted from human BM-MDSCs. The suppression was calculated, analyzing the number of proliferating cells from generation 3 to generation 10, assumed to be 100% without BM-MDSCs. Mean ± SE of 3 independent experiments. P ≤ .01, Student t test, all comparisons among BM-MDSCs containing cultures versus cultures without BM-MDSCs.
Figure 4
Figure 4
Phenotypic evaluation of the immune-suppressive subset CD11blow/−/CD16 contained within BM-MDSCs. (A) Flow cytometric analysis of CD11blow/−/CD16 cells sorted from BM-MDSCs. The expression of putative MDSCs markers, markers of mature and immature myeloid cells, and markers associated with tolerance was evaluated relative to isotype control (black histograms). In the figure is presented 1 representative of 2 independent experiments. (B) Confocal microscopic localization of MPO and ARG1 in CD11blow/−/CD16 cells, freshly isolated neutrophils, and monocytes. Scale bars = 12 μm. (C) Localization of MPO and ARG1 in CD11blow/−/CD16, CD11b+/CD16, and CD11b+/CD16+ cells isolated from fresh BM samples determined by confocal microscopy. Scale bars = 20 μm.
Figure 5
Figure 5
T-lymphocyte activation is driving BM-MDSC proliferation and immune suppression. (A) CellTrace-labeled PBMCs were stimulated with anti-CD3/CD28 in the presence of BM-MDSC CD11b+ and CD11blow/− cell subsets, added at a ratio of 1:1. After 3 days, cell cultures were harvested, labeled with anti-CD3ϵ, and analyzed in the CD3ϵ/CellTrace gate (M) and in the CD3ϵ+/CellTrace+ (T) cell gate. The numbers indicated in the top graphs refer to the percentage of cells gated on either T cells (T) or on myeloid cells (M). The central histograms show the profile of CellTrace dilution of either resting or stimulated T cells (gate T) cocultured with BM-MDSCs CD11b+ and CD11blow/− subsets. Black and gray curves refer to undivided and proliferating cells, respectively. The bottom histograms show Ki-67 expression in BM-MDSCs CD11b+ and CD11blow/− subsets (gate M) cocultured with either resting or stimulated T cells. Black histograms indicate isotype control. The figure shows a representative experiment of 3 performed. (B) Flow cytometric evaluation of CD11b, CD16, HLA-DR, CD34, and CD66b markers in CD11blow/− cell subset sorted from BM-MDSCs either before or after the coculture with resting or anti-CD3/anti-CD28–activated T cells. The expression of these markers was compared with the autofluorescence signal (black histograms). In the figure, 1 representative of 3 independent experiments is presented.
Figure 6
Figure 6
Increase in circulating MDSC levels over time in patients with advanced solid tumors is associated with decreased survival times and radiographic disease progression. Gating strategy for BM-MDSCs (A) and whole-blood MDSCs (B) is shown on a representative flow cytometric plot. (C) Random effects regression model and correlation between MDSCs and CTCs. Flow cytometric analysis was performed on peripheral whole blood in a separate cohort of patients with stage IV breast cancer (n = 25) before initiation of therapy and at defined intervals during therapy. Blood for CTC determination by the CellSearch was simultaneously drawn. A significant correlation was found between circulating MDSC levels (%) and CTCs (P = .0001). (D) Survival analysis by circulating MDSC levels (%) at first blood draw in patients with stage IV breast cancer starting a new line of systemic chemotherapy (n = 26). Survival estimates by median percentage of MDSCs (≤ 3.17% and > 3.17%) with the use of the first MDSCs observation (P = .048). (E) Survival estimates by median percentage of MDSCs (≤ 3.04% and > 3.04%) with the use of MDSCs levels drawn at the last visit (P = .018). (F) Survival analysis by circulating MDSC levels at time of study enrollment in patients with stage IV colorectal cancer. Survival estimates by medial percentage of MDSCs (≤ 2.54% and > 2.54%). (G) Analysis of relationship between changes in circulating MDSC levels over time and best radiographic response in patients receiving systemic chemotherapy (n = 25). Plot of MDSCs over time by “best response” defined as patients who achieved complete (CR) or partial radiographic response (PR) while on systemic therapy versus patients who did not. MDSCs were drawn prospectively after every other cycle of therapy. Over time circulating MDSCs were significantly higher in nonresponders than in patients with CR or PR as best response (*P = .015 comparing slopes).

References

    1. Gabrilovich DI, Nagaraj S. Myeloid-derived suppressor cells as regulators of the immune system. Nat Rev Immunol. 2009;9(3):162–174. - PMC - PubMed
    1. Peranzoni E, Zilio S, Marigo I, et al. Myeloid-derived suppressor cell heterogeneity and subset definition. Curr Opin Immunol. 2010;22(2):238–244. - PubMed
    1. Marigo I, Bosio E, Solito S, et al. Tumor-induced tolerance and immune suppression depend on the C/EBPbeta transcription factor. Immunity. 2010;32(6):790–802. - PubMed
    1. Mandruzzato S, Solito S, Falisi E, et al. IL4Ralpha+ myeloid-derived suppressor cell expansion in cancer patients. J Immunol. 2009;182(10):6562–6568. - PubMed
    1. Rodriguez PC, Ochoa AC. Arginine regulation by myeloid derived suppressor cells and tolerance in cancer: mechanisms and therapeutic perspectives. Immunol Rev. 2008;222:180–191. - PMC - PubMed

Publication types

MeSH terms