. 2011 Oct;85(4):779-87.
doi: 10.1095/biolreprod.111.092809. Epub 2011 Jul 6.

Generation of colonies of induced trophoblast cells during standard reprogramming of porcine fibroblasts to induced pluripotent stem cells

Affiliations

Generation of colonies of induced trophoblast cells during standard reprogramming of porcine fibroblasts to induced pluripotent stem cells

Toshihiko Ezashi et al. Biol Reprod. 2011 Oct.

Abstract

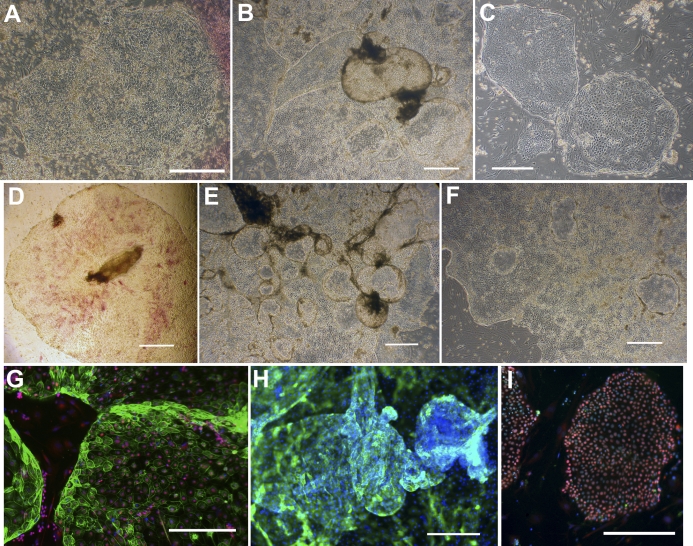
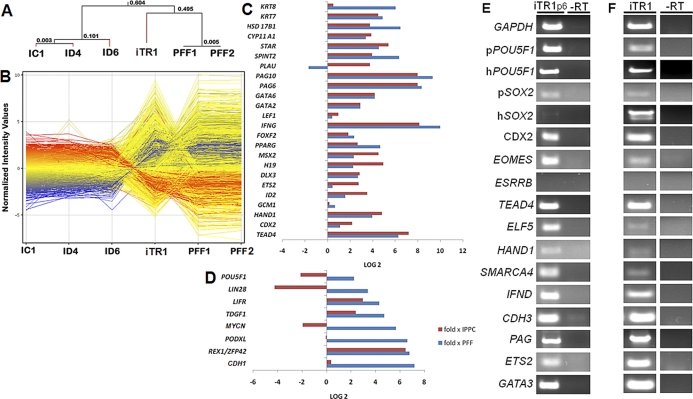
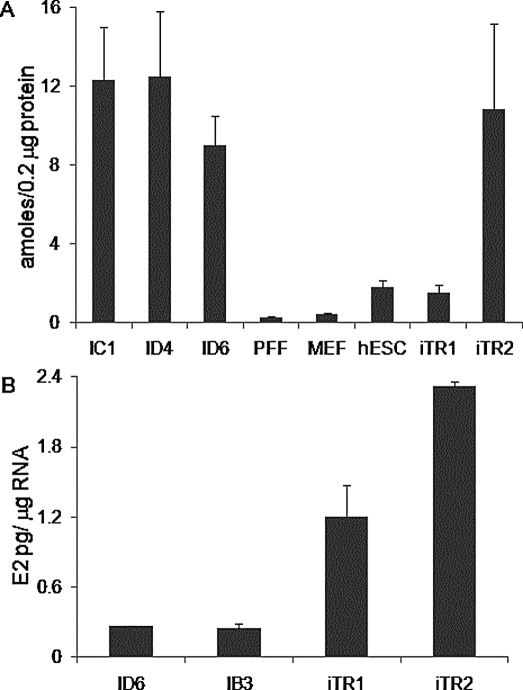
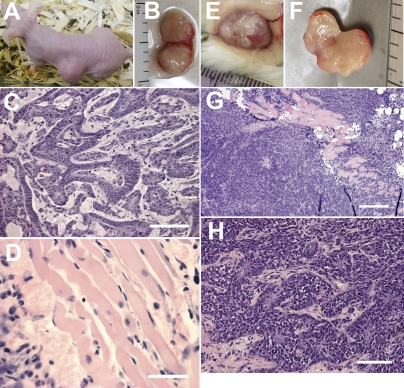
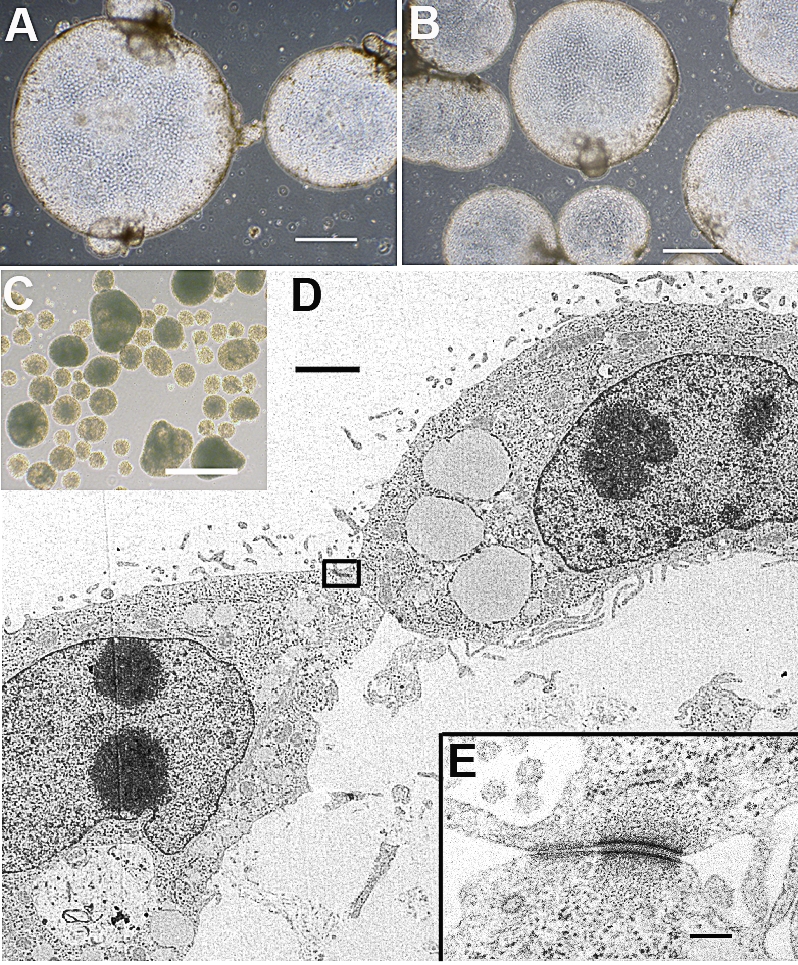
During reprogramming of porcine mesenchymal cells with a four-factor (POU5F1/SOX2/KLF4/MYC) mixture of vectors, a fraction of the colonies had an atypical phenotype and arose earlier than the recognizable porcine induced pluripotent stem (iPS) cell colonies. Within days after each passage, patches of cells with an epithelial phenotype formed raised domes, particularly under 20% O(2) conditions. Relative to gene expression of the iPS cells, there was up-regulation of genes for transcription factors associated with trophoblast (TR) lineage emergence, e.g., GATA2, PPARG, MSX2, DLX3, HAND1, GCM1, CDX2, ID2, ELF5, TCFAP2C, and TEAD4 and for genes required for synthesis of products more typical of differentiated TR, such as steroids (HSD17B1, CYP11A1, and STAR), pregnancy-associated glycoproteins (PAG6), and select cytokines (IFND, IFNG, and IL1B). Although POU5F1 was down-regulated relative to that in iPS cells, it was not silenced in the induced TR (iTR) cells over continued passage. Like iPS cells, iTR cells did not senesce on extended passage and displayed high telomerase activity. Upon xenografting into immunodeficient mice, iTR cells formed nonhemorrhagic teratomas composed largely of layers of epithelium expressing TR markers. When cultured under conditions that promoted embryoid body formation, iTR cells formed floating spheres consisting of a single epithelial sheet whose cells were tethered laterally by desmosome-like structures. In conclusion, reprogramming of porcine fibroblasts to iPS cells generates, as a by-product, colonies composed of self-renewing populations of TR cells, possibly containing TR stem cells.


Figures

FIG. 1.
FIG. 1.
Features of iTR cell colonies are shown. A) Emerging colony on original reprogramming plate at Day 22 after viral transduction is shown. The iTR colony, which provided the iTR1 line, was broken up physically and transferred fresh MEF feeder in stem cell medium containing KOSR and FGF2 (F2 medium), i.e., regular stem cell medium. B) During culture after the second passage (p2), we noted that the colonies contained a mixture of cell types, including areas that lifted from the substratum and formed domes. Areas forming domes were roughly ovoid and consisted exclusively of epithelial sheets. C) Small iTR1 colonies contain a heterogeneous mixture of morphologically distinct cell types, including ones with an epithelial appearance. D) A larger iTR1 cell colony stained for alkaline phosphatase (AP). Although epithelial cells with larger cytoplasm were negative for AP, smaller cells are weakly positive. The colony shown had possessed a centrally placed ovoid dome that shrank and collapsed during fixation. E) If colonies are cultured beyond 10 days in F2 medium under 20% O2, iTR colonies became largely epithelial, with most of the surface covered with well-developed “dome-like” structures that give rise to floating spheres. F) In parallel experiments in which iTR cells had been generated under 4% O2 and then maintained under these conditions, iTR colonies showed a more modest development of domes (images captured at Day 14 of culture at p1). Bars = 500 μm in AF. Immunostaining of regions of an iTR1 colony (G, H) and iPS cell colonies (line ID6 [I]) for KRT7 (green [G, H, I]) and SOX2 (red [G and I]). Nuclei have been counterstained with DAPI (blue [G, H, I]). KRT7 staining was evident in the epithelioid cells and was prominent in the outer regions of the colony (G). The domes also stained intensely for KRT7 and frequently rounded off to form floating vesicles (H). H) Focus was adjusted to the protruding tip of a dome so that the cells attached to the coverslip were out of focus. All cells in iTR and iPS colonies stained positively for SOX2, although immunostaining could not distinguish between the endogenous gene product and SOX2 expressed from the reprogramming gene (G, I). KRT7 expression was observed only in iTR cells. Bars = 200 μm in GI.
FIG. 2.
FIG. 2.
Transcriptome analysis of porcine iTR cells by microarray analysis is shown. A) Hierarchical clustering of the microarray data of iTR1 and three iPS cells (IC1, ID4, and ID6) and parental fibroblast lines (PFF) reported previously [15] show clear branching of the iTR1 line from the pluripotent iPS cell lines and the somatic cells (PFF). B) Normalized intensities of the genes reveal striking differences in gene expression of the iTR1 line in comparison to the iPS and PFF cells. Log2-fold change in TR (C) and pluripotent (D) gene expression in iTR1 cells compared to iPS cells (red bars) and PFF (blue bars). E, F) Candidate gene expression analysis of iTR1 cells and teratomas. E) Semiquantitative RT-PCR analysis was conducted for expression of selected pluripotency and TR marker genes from cells at passage (p) 6 cultured in F2 medium. The “RT” lanes indicate control reactions without reverse transcriptase. F) Similar PCR analysis of reverse transcribed RNA from a teratoma derived from iTR1 at p7 is shown.
FIG. 3.
FIG. 3.
Telomerase activity of iTR cells is shown. A) Telomerase activity was measured enzymatically in two iTR lines (iTR1 passage [p] 6, iTR2 p3), three iPS cells (IC1, ID4, and ID6, p10); parental PFF, p10; MEF, p4; and H9 hES cells, p41. The assay was performed in triplicate samples with 0.2 μg of total cell protein by using Trapeze-RT telomerase detection kit (Chemicon). Activities represent relative units of telomerase assessed by the quantity of primers (amole/sample) extended with telomeric repeats. Data are presented as means ± SEM. B) Relative production of estradiol by iPS cells and iTR cells. Values show the relative amounts of estradiol released into the medium after culturing two iPS cell lines (ID6 and IB3) and two iTR lines (iTR1 and iTR2) in F2 medium for 48 h (from Day 4 until Day 6 after passage when the cells were harvested). Bars (±SEM) represent estradiol concentrations (pg/ml) normalized to the total RNA amount (μg). ID6 and IB3 cells were at passage 38 and 35, respectively; iTR1 and iTR2 were at passage 35 and 19, respectively.
FIG. 4.
FIG. 4.
Teratoma formation from injected iTR1 cells is shown. AD) Tumor derived from iTR1 p7 cells; (E to H) iTR1 p11 cells. CD-1 nude mouse 11 weeks after subcutaneous injection (A); a tumor 13 weeks after injection of iTR1 p11 cells into a NOD SCID mouse (in millimeters) (E). Cross-section of encapsulated tumors (in inches) (B, F); most tumors consisted of packed layers of epithelial-like cells (C, G, H), but islands of striated muscle were observed near the margins of the tumor close to where it attached to the peritoneum (D, G). Bars = 100 μm in C; 50 μm in D; 250 μm in G; and 100 μm in H.
FIG. 5.
FIG. 5.
Cell sphere formation from iTR cells is shown. Spheres from iTR1 p42 (A) and iTR2 p7 cells are shown (B). C) Embryoid body formation from an iPS cell line (ID6, p5) is shown. Bars in AC = 500 μm. D) Ultrastructure of a portion of a cell sphere from iTR2 cells (85-nm-thick section; bar = 2 μm). E) Cell junction (area boxed in D) shows a desmosome-like structure. Bar = 0.2 μm.

Similar articles

Cited by

References

    1. Tanaka S, Kunath T, Hadjantonakis AK, Nagy A, Rossant J. Promotion of trophoblast stem cell proliferation by FGF4. Science 1998; 282: 2072 2075 - PubMed
    1. Roberts RM, Fisher SJ. Trophoblast stem cells. Biol Reprod 2011; 84: 412 421 - PMC - PubMed
    1. Vandevoort CA, Thirkill TL, Douglas GC. Blastocyst-derived trophoblast stem cells from the rhesus monkey. Stem Cells Dev 2007; 16: 779 788 - PubMed
    1. Tanaka S. Derivation and culture of mouse trophoblast stem cells in vitro. Methods Mol Biol 2006; 329: 35 44 - PubMed
    1. Guzman-Ayala M, Ben-Haim N, Beck S, Constam DB. Nodal protein processing and fibroblast growth factor 4 synergize to maintain a trophoblast stem cell microenvironment. Proc Natl Acad Sci U S A 2004; 101: 15656 15660 - PMC - PubMed

Publication types

MeSH terms