. 2011 Jul 6;31(27):9895-904.
doi: 10.1523/JNEUROSCI.6223-10.2011.

The striatum is highly susceptible to mitochondrial oxidative phosphorylation dysfunctions

Affiliations

The striatum is highly susceptible to mitochondrial oxidative phosphorylation dysfunctions

Alicia M Pickrell et al. J Neurosci. .

Abstract

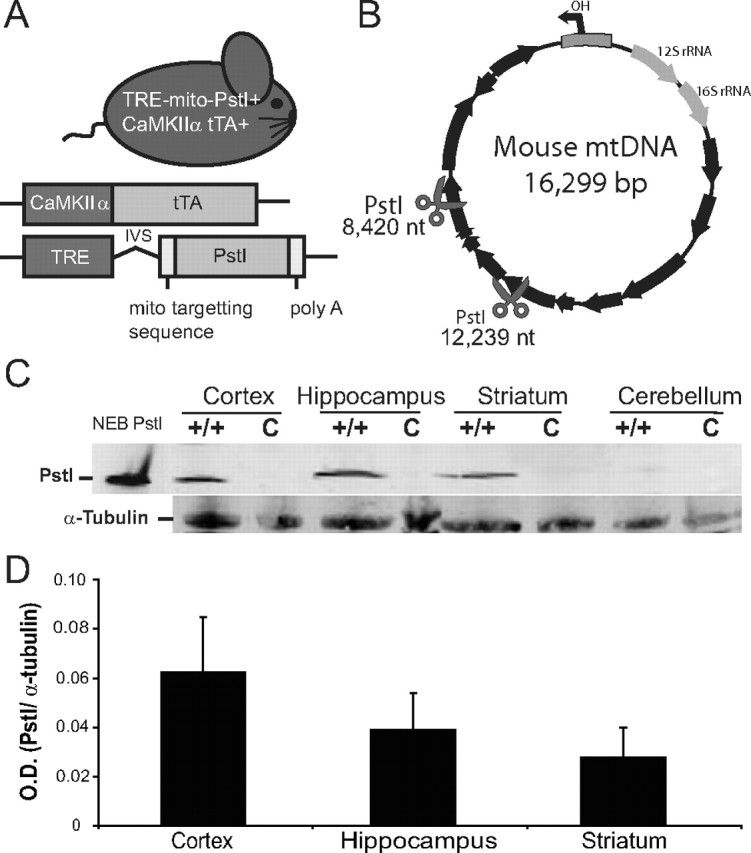
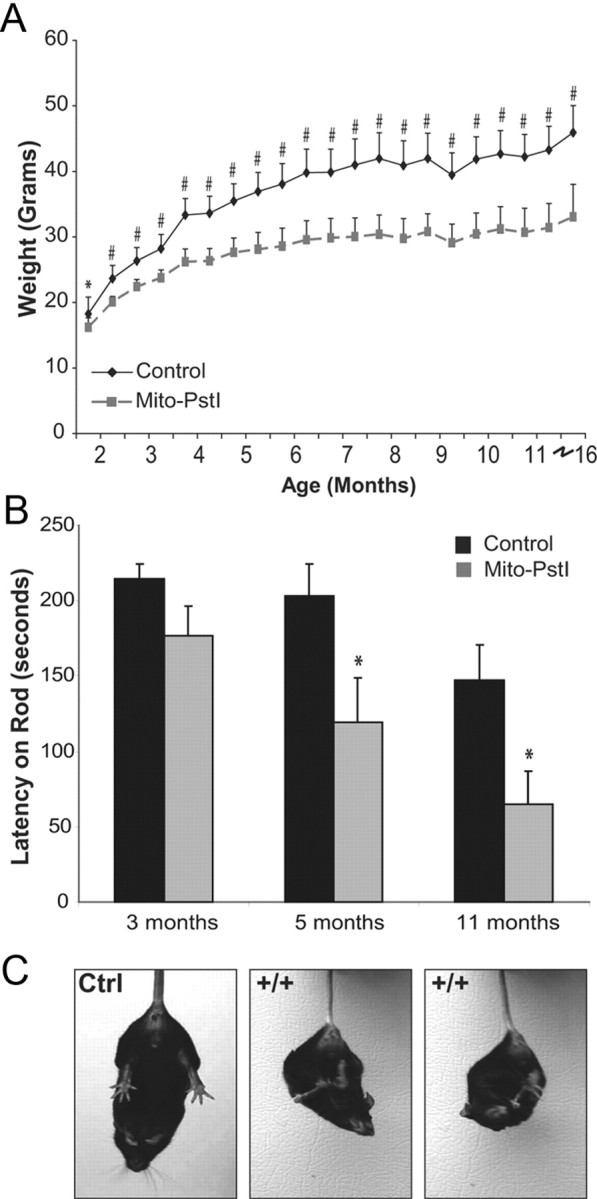
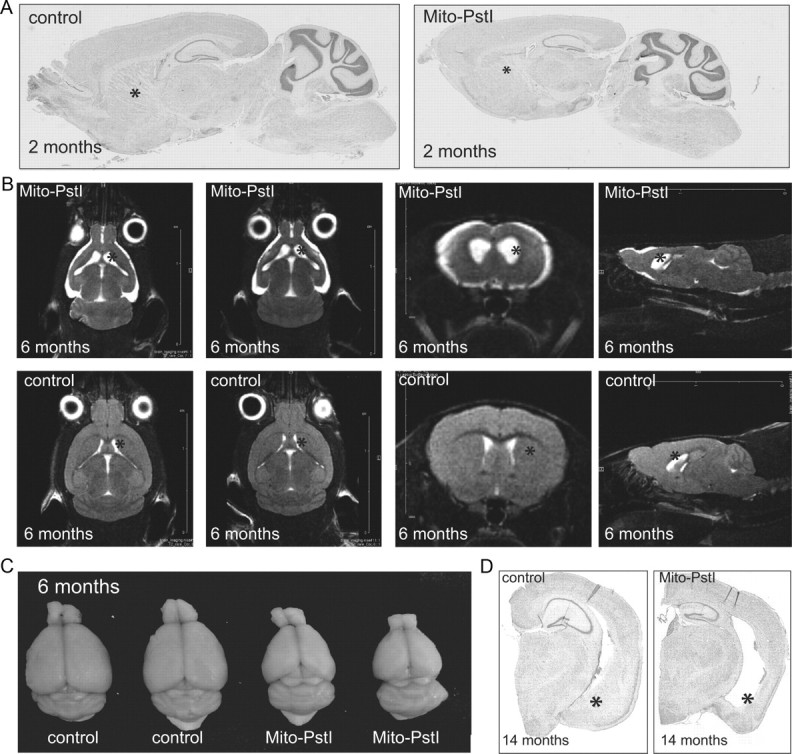
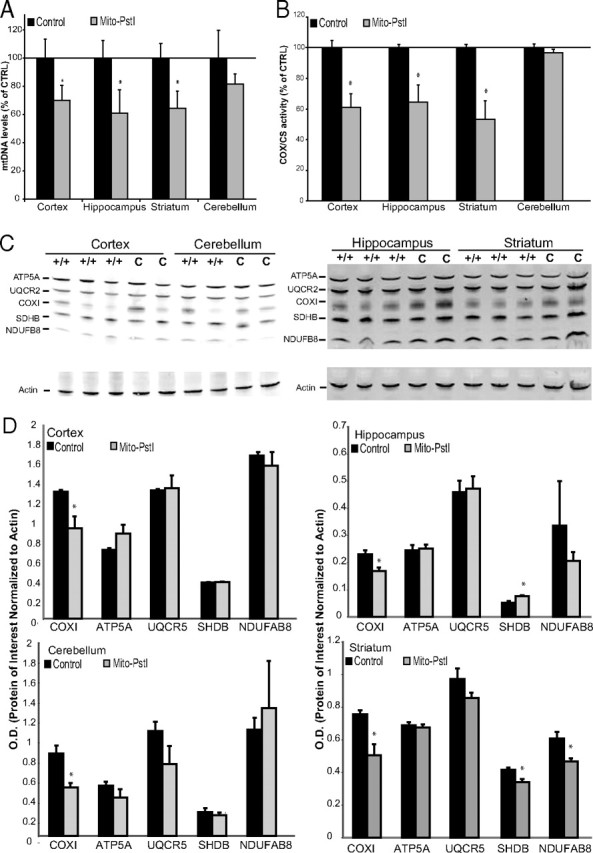
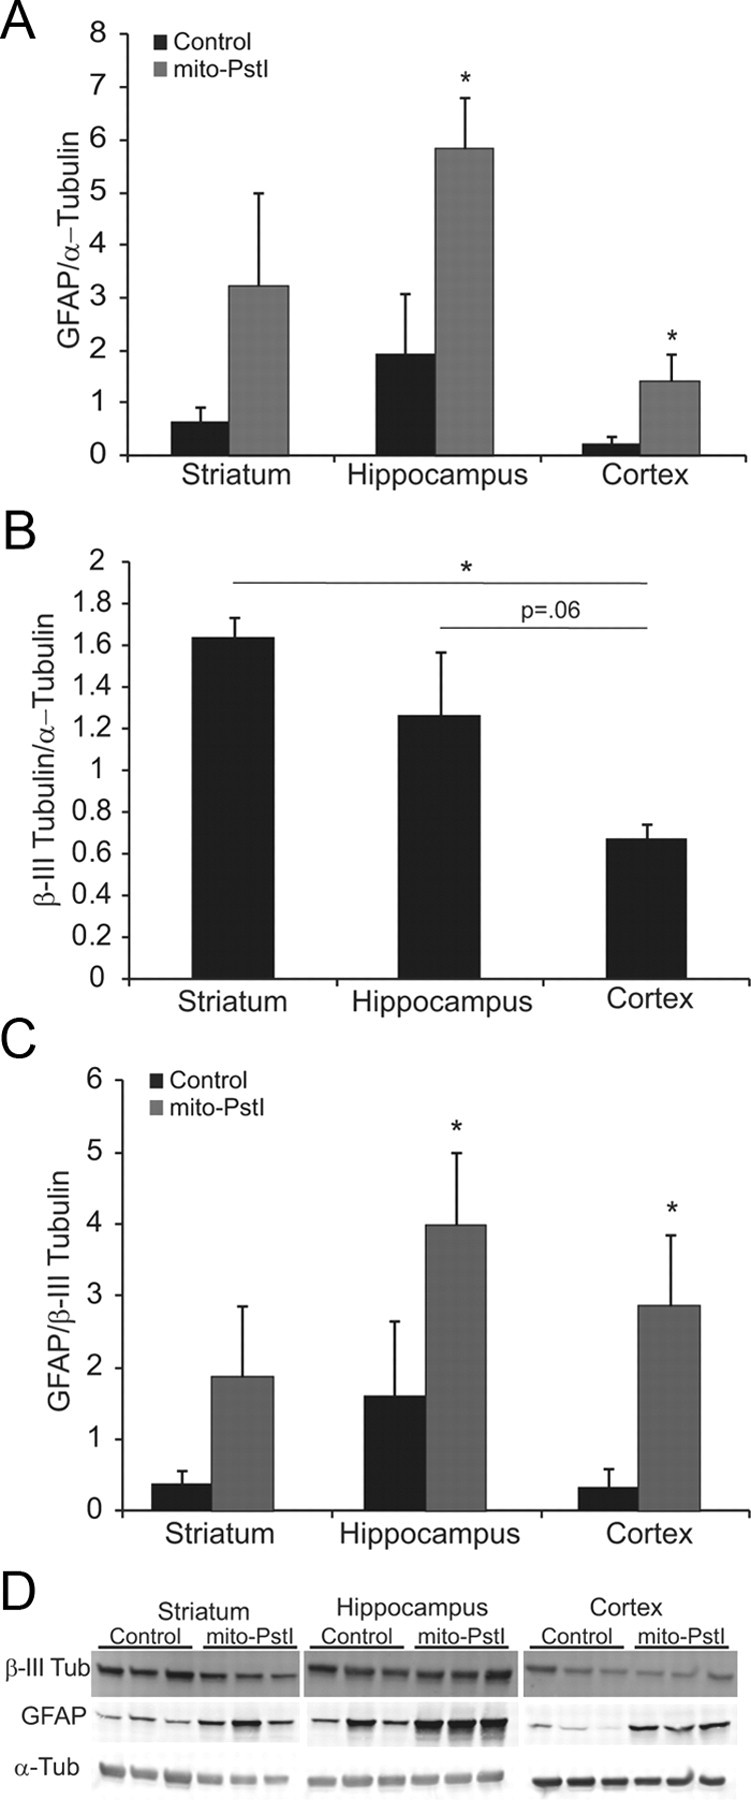
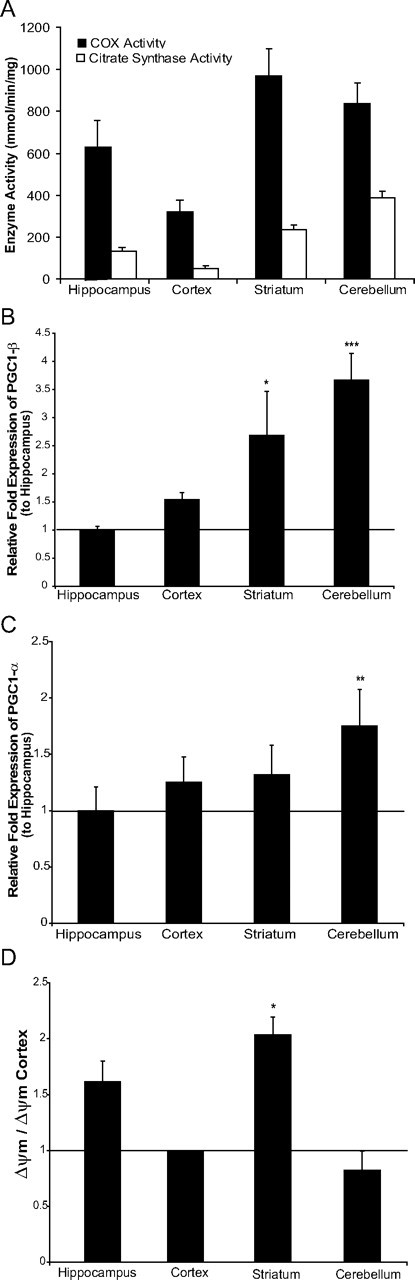
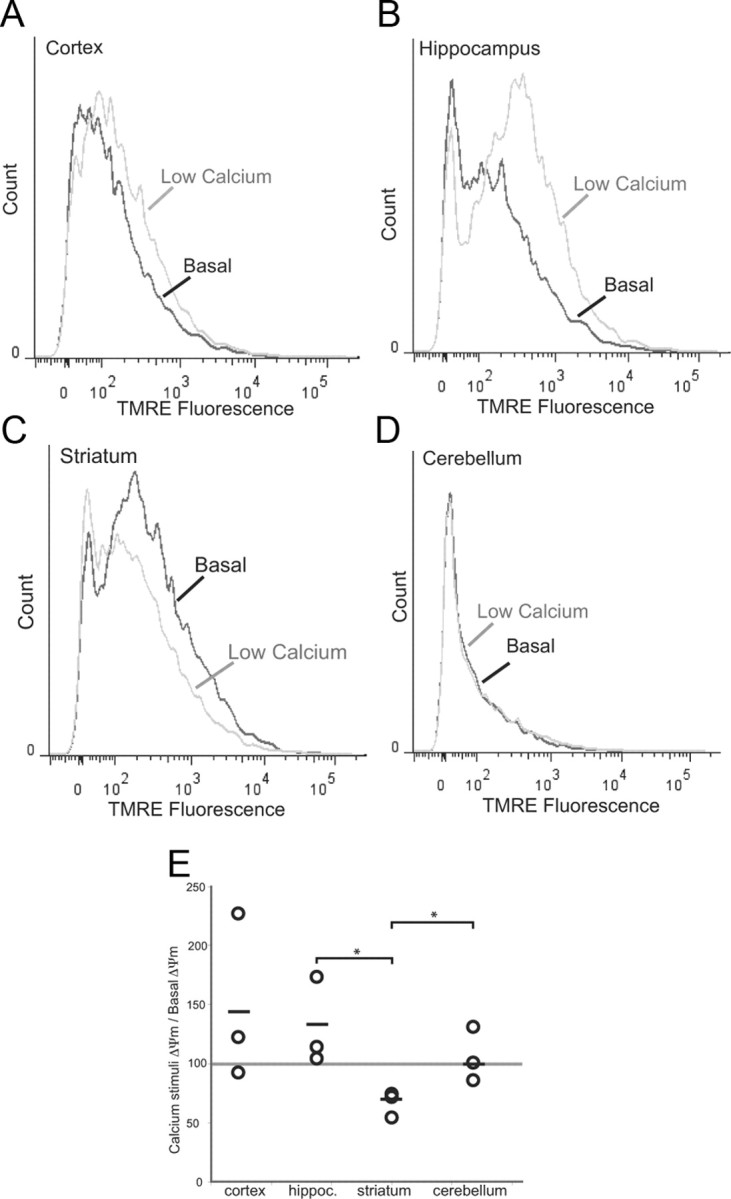
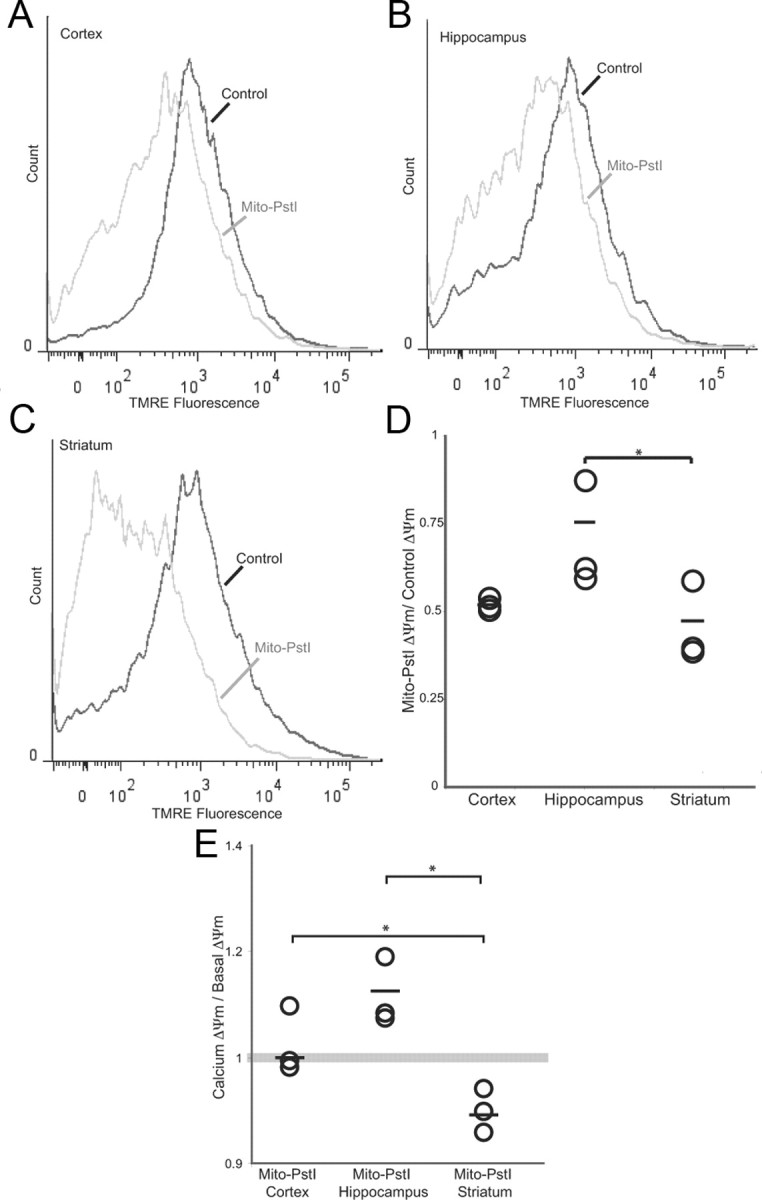
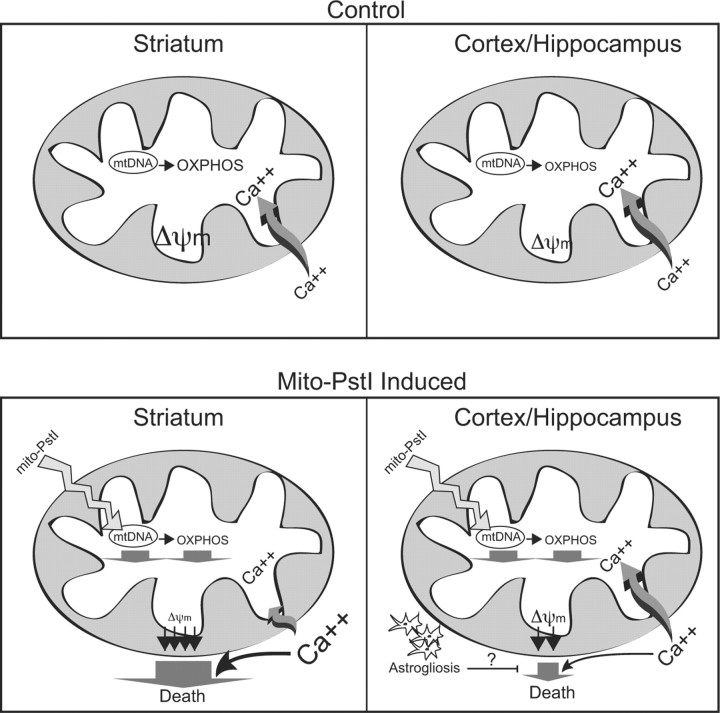
Neuronal oxidative phosphorylation (OXPHOS) deficiency has been associated with a variety of neurodegenerative diseases, including Parkinson's disease and Huntington's disease. However, it is not clear how mitochondrial dysfunction alone can lead to a preferential elimination of certain neuronal populations in vivo. We compared different types of neuronal populations undergoing the same OXPHOS deficiency to determine their relative susceptibility and mechanisms responsible for selective neuron vulnerability. We used a mouse model expressing a mitochondria-targeted restriction enzyme, PstI or mito-PstI. The expression of mito-PstI induces double-strand breaks in the mitochondrial DNA (mtDNA), leading to OXPHOS deficiency, mostly due to mtDNA depletion. We targeted mito-PstI expression to the cortex, hippocampus, and striatum under the CaMKII-α promoter. Animals undergoing long-term expression of mito-PstI displayed a selective worsening of the striatum over cortical and hippocampal areas. Mito-PstI expression and mtDNA depletion were not worse in the striatum, but the latter showed the most severe defects in mitochondrial membrane potential, response to calcium, and survival. These results showed that the striatum is particularly sensitive to defects in OXPHOS possibly due to an increased reliance on OXPHOS function in this area and differences in response to physiological stimuli. These results may help explain the neuropathological features associated with Huntington's disease, which have been associated with OXPHOS defects.


Figures

Figure 1.
Figure 1.
Mito-PstI mouse expresses mitochondrial-targeted restriction endonuclease in the CNS. A, Schematic representation of the experimental mito-PstI mouse and the transgenic constructs it harbors. B, Representative mtDNA map showing the targeted sites of PstI at 8420 and 12,239 nt (scissors). Black arrows denote protein-coding genes. C, Western blots of brain lysates using antibodies probing for mito-PstI protein expressed in four regions of the CNS (cortex, hippocampus, striatum, and cerebellum) of 2-month-old mito-PstI (+/+) or control (c) animals. α-Tubulin immunoreactivity was used to ensure equal protein loading. D, Quantification of the optical density (O.D.) of immunoblotted PstI protein levels from mito-PstI mice. Results are normalized against α-tubulin immunoreactivity. Values are mean ± SEM (n = 3, NS).
Figure 2.
Figure 2.
Mito-PstI mice displayed abnormal motor behaviors indicative of a progressive neurodegenerative pathology. A, Mito-PstI mice had significantly less body weight than controls. By the end of the study, Mito-PstI animals were approximately half the weight of controls. B, RotaRod behavioral testing revealed that Mito-PstI mice showed deficits on the ability to coordinate movement and balance on a rotating rod. Mito-PstI mice had shorter latency times when tested as compared to controls at 5 and 11 month time points. C, Mito-PstI mice display an abnormal clasping phenotype during a gravitational tail hang. Controls showed a proper limb extension behavior for escape. Phenotype appears at ∼6–7 months of age and persists for the rest of life. Values are mean ± SEM (control n = 11, mito-PstI = 9, *p < 0.05, #p < 0.001).
Figure 3.
Figure 3.
Mito-PstI mice have an age-related neurodegeneration with a preferential degeneration of the striatum. A, Parasagittal Nissl-stained histological sections of 2-month-old animals. B, Nuclear magnetic resonance imaging of 6- to 7-month-old control and mito-PstI mice in vivo reveal ongoing degeneration with ablation of the striatum with cortical atrophy. The striatum is denoted by asterisks. White areas represent CSF (n = 2/group). C, Gross morphology reveals abnormal brain size and appearance of mito-PstI animals as compared to control at 6–7 months of age. Control brain weight was ∼0.42–0.45 g, and mito-PstI weight was ∼0.27–0.30 g. D, Nissl staining of coronal sections reveals that, at 14 months of age, degeneration in the mito-PstI occurs in the ventral aspects of the striatum (denoted by asterisks), which is absent in controls.
Figure 4.
Figure 4.
Mito-PstI expression causes an mtDNA depletion that leads to an OXPHOS deficiency. A, Real-time PCR measuring the levels of mtDNA against the nuclear gene GAPDH. Isolated DNA was extracted from cortex, hippocampus, striatum, and cerebellum from 2-month-old control and Mito-PstI animals and used as the template. Values are mean ± SEM (n = 4–5/group, *p < 0.05). Each sample was run in triplicate. B, Ratios of enzymatic COX activity to CS activity comparing control and Mito-PstI animals in different CNS regions at 2 months of age. Values are mean ± SEM (n = 4–5/group, *p < 0.05). Results are shown as a percentage of the control. C, Representative Western blot analyses showing OXPHOS protein subunits from cortical, hippocampal, cerebellar, and striatal lysates [Complex V ATPase subunit α (ATP5A), Complex III Core 2 (UQCR2), Complex IV (COXI), Complex II subunit 30 kDa (SDHB), and Complex I (NDUFB8)] between 2 month control (C) and Mito-PstI (+/+) animals (n = 2–3/group). Actin immunoreactivity was used as a control to ensure equal protein loading. D, Optical density measurements of the protein of interest normalized to the signal from actin between 2 month control and Mito-PstI animals (n = 3/group). *p < 0.05.
Figure 5.
Figure 5.
Striatum is enriched in neuronal-derived cells. A, Ratio of the optical density of immunoreactive GFAP/α-tubulin from Western blots of striatal, cortical, and hippocampal homogenates from 6-month-old animals. B, Ratio of the optical density of immunoreactive β-III tubulin/α-tubulin of Western blots of striatal, cortical, and hippocampal homogenates from 6-month-old animals. C, Ratio of the optical density of immunoreactive GFAP/β-III tubulin Western blots of striatal, cortical, and hippocampal homogenates from 6-month-old animals. D, Western blots from where quantitations were performed. Error bars represent SD; *p < 0.05, n = 3.
Figure 6.
Figure 6.
Striatum has a relatively high mitochondrial bioenergetics. A, COX activity and CS spectrophotometer assays comparing the activity per milligram of protein in cortex, hippocampus, striatum, and cerebellum. Values are mean ± SEM (n = 4–5/group). Significance of comparisons between regions for COX activity was as follows: cortex versus hippocampus, p = 0.0015; hippocampus versus striatum, p = 0.013; striatum versus cortex, p = 0.0012; cerebellum versus cortex, p = 0.041; cerebellum versus hippocampus, NS; cerebellum versus striatum, NS. Significance of comparisons between regions for CS activity was as follows: cortex versus hippocampus, p = 0.0044; hippocampus versus striatum, p = 0.0017; striatum versus cortex, p = 0.00011; cerebellum versus cortex, p = 8.27 × 10⁻⁶; cerebellum versus hippocampus, p = 6.80 × 10⁻⁶; cerebellum versus striatum, p = 0.00049. B, Relative fold expression of PGC-1β levels compared to hippocampus when normalized to β-actin expression. Values are mean ± SEM (control n = 4–5, mito-PstI = 4–5, *p < 0.05, ***p < 0.001). C, Relative fold expression of PGC-1α levels compared to hippocampus when normalized to β-actin expression. Values are mean ± SEM (control n = 4–5, mito-PstI = 4–5, **p < 0.01). D, Region-specific mean of fluorescence of isolated mitochondria stained with TMRE. Values are mean ± SEM (control n = 4–5, mito-PstI = 4–5, *p < 0.05).
Figure 7.
Figure 7.
Mitochondrial membrane potential from striatum mitochondria of wild-type mice is highly sensitive to calcium stimulation. Histograms depicting TMRE fluorescence of mitochondria from a 2-month-old wild-type mouse at basal conditions or treated with calcium (0.3 μmol/mg protein). A, Cortex. B, Hippocampus. C, Striatum. D, Cerebellum. E, Plotted changes in (ΔΨm[Ca2+]/ΔΨm basal) from cortex, hippocampus, striatum, and cerebellum. Circles represent individual animals (n = 3). Horizontal line represents mean. *p < 0.05.
Figure 8.
Figure 8.
Basal ΔΨm is particularly decreased in the striatum of mito-PstI mice. Histograms depicting TMRE fluorescence of mitochondria from 2-month-old wild-type and Mito-PstI mice mouse at basal conditions. A, Cortex. B, Hippocampus. C, Striatum. D, Plotted changes in Mito-PstI ΔΨm/wild-type ΔΨm of cortex, hippocampus, and striatum. Circles represent individual animals (n = 3). Horizontal line represents mean. *p < 0.05. E, Plotted changes of the ratio of ΔΨm of mitochondria treated with low calcium to basal ΔΨm of the cortex, hippocampus, and striatum of Mito-PstI animals. Geometric fluorescence values were determined when gating for high ΔΨm mitochondria. Circles represent individual animals (n = 3). Horizontal line represents mean. *p < 0.05.
Figure 9.
Figure 9.
Proposed mechanism for the striatum vulnerability to OXPHOS defects. The upper panels depict a model under normal conditions. Control striatal mitochondria would have robust OXPHOS function, membrane potential, and would be more sensitive to a calcium stimulus as compared to cortical/hippocampal mitochondria. The lower panels depict the consequences of mito-PstI expression. Mito-PstI leads to mtDNA damage and decreases in OXPHOS. OXPHOS-dependent ΔΨm is relatively high in the striatum, and the OXPHOS defect leads to a marked collapse in ΔΨm with a consequent impairment in Ca2+ buffering. This leads to increased cytosolic Ca2+, which activates Ca2+-sensitive proteases causing neuronal death. Astrocytosis, observed mostly in cortex and hippocampus after mito-PstI expression, may have a protective effect by supplying neurons with metabolic substrates (e.g., lactate) or other prosurvival factors.

Similar articles

Cited by

References

    1. Anderson S, Bankier AT, Barrell BG, de Bruijn MH, Coulson AR, Drouin J, Eperon IC, Nierlich DP, Roe BA, Sanger F, Schreier PH, Smith AJ, Staden R, Young IG. Sequence and organization of the human mitochondrial genome. Nature. 1981;290:457–465. - PubMed
    1. Barrientos A. In vivo and in organello assessment of OXPHOS activities. Methods. 2002;26:307–316. - PubMed
    1. Berthet C, Lei H, Thevenet J, Gruetter R, Magistretti PJ, Hirt L. Neuroprotective role of lactate after cerebral ischemia. J Cereb Blood Flow Metab. 2009;29:1780–1789. - PubMed
    1. Betarbet R, Sherer TB, MacKenzie G, Garcia-Osuna M, Panov AV, Greenamyre JT. Chronic systemic pesticide exposure reproduces features of Parkinson's disease. Nat Neurosci. 2000;3:1301–1306. - PubMed
    1. Brookes PS, Yoon Y, Robotham JL, Anders MW, Sheu SS. Calcium, ATP, and ROS: a mitochondrial love-hate triangle. Am J Physiol Cell Physiol. 2004;287:C817–833. - PubMed

Publication types

MeSH terms

Substances