. 2011 Jul 6;31(27):9998-10008.
doi: 10.1523/JNEUROSCI.5640-10.2011.

The role of neuronal connexins 36 and 45 in shaping spontaneous firing patterns in the developing retina

Affiliations

The role of neuronal connexins 36 and 45 in shaping spontaneous firing patterns in the developing retina

Aaron G Blankenship et al. J Neurosci. .

Abstract

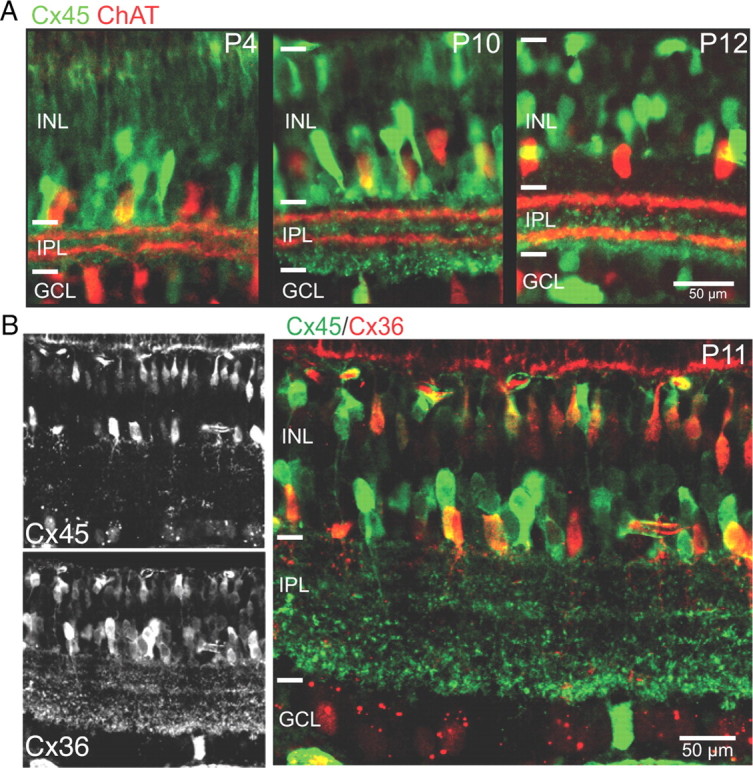
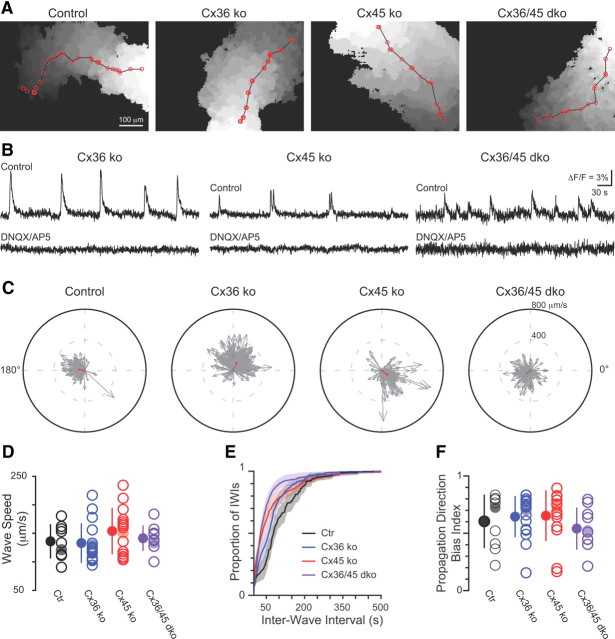
Gap junction coupling synchronizes activity among neurons in adult neural circuits, but its role in coordinating activity during development is less known. The developing retina exhibits retinal waves--spontaneous depolarizations that propagate among retinal interneurons and drive retinal ganglion cells (RGCs) to fire correlated bursts of action potentials. During development, two connexin isoforms, connexin 36 (Cx36) and Cx45, are expressed in bipolar cells and RGCs, and therefore provide a potential substrate for coordinating network activity. To determine whether gap junctions contribute to retinal waves, we compared spontaneous activity patterns using calcium imaging, whole-cell recording, and multielectrode array recording in control, single-knock-out (ko) mice lacking Cx45 and double-knock-out (dko) mice lacking both isoforms. Wave frequency, propagation speed, and bias in propagation direction were similar in control, Cx36ko, Cx45ko, and Cx36/45dko retinas. However, the spontaneous firing rate of individual retinal ganglion cells was elevated in Cx45ko retinas, similar to Cx36ko retinas (Hansen et al., 2005; Torborg and Feller, 2005), a phenotype that was more pronounced in Cx36/45dko retinas. As a result, spatial correlations, as assayed by nearest-neighbor correlation and functional connectivity maps, were significantly altered. In addition, Cx36/45dko mice had reduced eye-specific segregation of retinogeniculate afferents. Together, these findings suggest that although Cx36 and Cx45 do not play a role in gross spatial and temporal propagation properties of retinal waves, they strongly modulate the firing pattern of individual RGCs, ensuring strongly correlated firing between nearby RGCs and normal patterning of retinogeniculate projections.


Figures

Figure 1.
Figure 1.
Cx45 is strongly expressed throughout postnatal development. A, GFP (green) expressed under the Cx45 promoter at P4, P10, and P12. ChAT (red) is shown for reference. B, P11 Cx36/45dko retinas double labeled with antibodies to β-gal (red) and GFP (green) show partial colocalization of Cx45 and Cx36 in bipolar cells and distinct labeling of amacrine and retinal ganglion cells. INL, Inner nuclear layer; IPL, inner plexiform layer; GCL, retinal ganglion cell layer. Scale bar, 50 μm.
Figure 2.
Figure 2.
Tonic firing between waves is elevated in Cx45ko and Cx36/45dko mice. A, Raster plots of 10 single-unit spike trains over a 10 min interval, recorded from retinas isolated from P12 control, P11 Cx45ko, and P10 Cx36/45dko retinas. Purple shaded regions indicate waves. B, Pairwise correlation index as a function of intercellular distance for Ctr (black), Cx45ko (red), and Cx36/45dko (purple). Data points are averages of median values from individual retinas. Error bars are ±SD. Inset shows the same data normalized within each genotype to the maximum correlation index. C, Percentage of time cells fire above 1 Hz (left) and 10 Hz (right), based on 1 s time bins during inter-wave intervals. Percentages were obtained across all inter-wave intervals pooled within a genotype. Bars are mean ± SD. D, Correlation matrices for example retinas from each genotype. The correlation coefficient was computed as in B for every possible pair of cells in each retina. The x- and y-axes correspond to all single units isolated from that retina. Diagonals (i.e., autocorrelations) were set to zero. Because the distribution of correlation coefficients followed a power-law, they are plotted on a logarithmic scale. E, Connection matrices for example retinas shown in D. Circles correspond to locations of units identified by spike sorting, with the diameter of the circle scaled by the magnitude of the normalized correlation index, such that the largest circles correspond to the largest average correlation index found in the example retina. Units that were localized on the same electrode are slightly displaced. Red circles correspond to units that had connections (i.e., high correlation indices) with at least 15% of the other units (connections shown with blue lines). F, Cumulative distributions of the distances between the most highly connected RGCs and the units to which they are connected (see Materials and Methods).
Figure 3.
Figure 3.
Spatiotemporal properties of retinal waves are similar in control, Cx36ko, Cx45ko, and Cx36/45dko. A, Examples of waves recorded in different genotypes. Each grayscale value represents an active area in one frame, with darker shades corresponding to later points in time during the wave. The red line represents the path of the wave and the circles represent the points along the wave where the vectors were measured to determine the direction of wave propagation. B, Time course of ΔF/F in gap junction knock-out retinas before and during application of the ionotropic glutamate receptor antagonists DNQX (10 μm) and AP5 (50 μm). C, Polar plots showing the propagation bias from the example retinas shown in A (red arrow) as determined by summation of individual vectors representing movement of local wavefront (gray arrows). Individual vectors are the velocities measured between red dots in the example waves shown in A and in all other waves from these four retinas. D, Summary of wavefront propagation speed. Open circles, Mean speeds for individual retinas; closed circles, mean of all retinas; error bars are SD. The shaded circles are the example retinas in A. E, Cumulative probability histogram of inter-wave intervals (IWIs) from all P10–P13 retinas. Shaded areas are ±SEM. F, Summary of propagation bias index recorded in all retinas from all genotypes. Open circles are the normalized magnitudes of the propagation direction bias for individual retinas; closed circles are means ± SD from all retinas in a genotype; shaded circles are the example retinas shown in A and C.
Figure 4.
Figure 4.
Normal wave-associated synaptic inputs in Cx45ko and Cx36/45dko. A, Simultaneous whole-cell voltage-clamp recordings from two neighboring RGCs in a P10 Cx45ko mouse showing cIPSCs (top) and cEPSCs (bottom). Left, Control ACSF; right, 20 μm DNQX + 50 μm AP5. B, Same as A, from a P10 Cx36/45dko mouse. Calibration in A applies to A and B. C, Average cEPSC cluster frequency. Open circles are individual cells, closed circles are medians of all cells per genotype, and bars are quartiles. D, Raster plot of 10 single-unit spike trains from a P11 Cx36/45dko retina before and after application of 20 μm DNQX + 50 μm AP5. Recordings in each condition are 5 min long. E, Average firing rate of individual RGCs in MEA recordings in the absence and presence of 20 μm DNQX + 50 μm AP5. Open circles are single units, closed circles are means of all units; error bars are obscured by the data points.
Figure 5.
Figure 5.
Cholinergic waves persist in connexin knock-out mice. A, Time course of ΔF/F in gap junction knock-out retinas before and during application of the nicotinic acetylcholine receptor antagonist DHβE (8 μm). B, Cumulative probability histogram of inter-wave intervals (IWIs) from all P4–P6 retinas. C, Graph of wavefront propagation speed. Open circles, Mean speeds for individual retinas; closed circles, mean of all retinas; error bars are SD.
Figure 6.
Figure 6.
Cx36/45dko mice have reduced eye-specific segregation of retinogeniculate projections. A, Fluorescence images of dLGN sections in control (top) and Cx36/45dko (bottom) mice. Left, Fluorescence of Alexa 488-labeled, contralateral-projecting retinogeniculate axons; middle, fluorescence of Alexa 594-labeled, ipsilateral-projecting retinogeniculate axons; right, pseudocolor images based on the logarithm of the intensity ratio (r = log(FI/FC)) for each pixel. Scale bar, 200 μm. B, Summary of the variance of the distribution of the R values for all the pixels in the images in each brain. The broader the distribution of R values is for a given dLGN, the greater the extent of segregation. Closed circles are mean ± SEM; open circles are individual brains; shaded circles are the examples shown in A. SEM for Cx36/45dko is obscured by the data point. *p < 0.05; **p < 0.01.

References

    1. Arai I, Tanaka M, Tachibana M. Active roles of electrically coupled bipolar cell network in the adult retina. J Neurosci. 2010;30:9260–9270. - PMC - PubMed
    1. Belluardo N, Mudò G, Trovato-Salinaro A, Le Gurun S, Charollais A, Serre-Beinier V, Amato G, Haefliger JA, Meda P, Condorelli DF. Expression of connexin36 in the adult and developing rat brain. Brain Res. 2000;865:121–138. - PubMed
    1. Blankenship AG, Feller MB. Mechanisms underlying spontaneous patterned activity in developing neural circuits. Nat Rev Neurosci. 2010;11:18–29. - PMC - PubMed
    1. Blankenship AG, Ford KJ, Johnson J, Seal RP, Edwards RH, Copenhagen DR, Feller MB. Synaptic and extrasynaptic factors governing glutamatergic retinal waves. Neuron. 2009;62:230–241. - PMC - PubMed
    1. Bloomfield SA, Völgyi B. The diverse functional roles and regulation of neuronal gap junctions in the retina. Nat Rev Neurosci. 2009;10:495–506. - PMC - PubMed

Publication types

MeSH terms