Review
. 2011 Jul 5:7:509.
doi: 10.1038/msb.2011.42.

Microbial laboratory evolution in the era of genome-scale science

Affiliations
Review

Microbial laboratory evolution in the era of genome-scale science

Tom M Conrad et al. Mol Syst Biol. .

Abstract

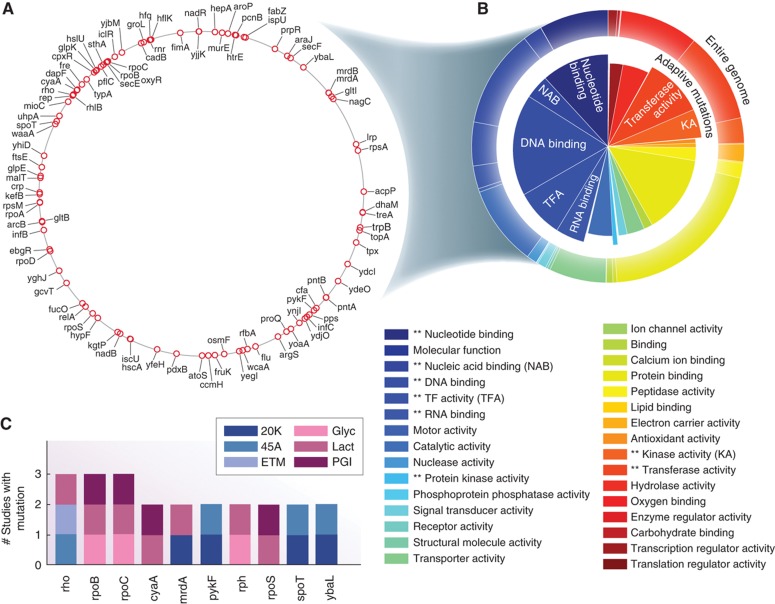
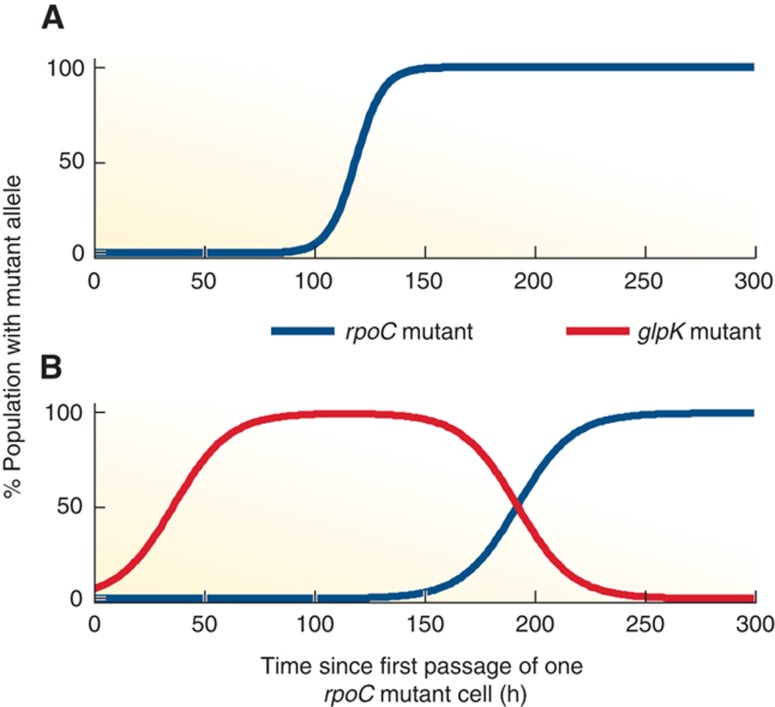
Laboratory evolution studies provide fundamental biological insight through direct observation of the evolution process. They not only enable testing of evolutionary theory and principles, but also have applications to metabolic engineering and human health. Genome-scale tools are revolutionizing studies of laboratory evolution by providing complete determination of the genetic basis of adaptation and the changes in the organism's gene expression state. Here, we review studies centered on four central themes of laboratory evolution studies: (1) the genetic basis of adaptation; (2) the importance of mutations to genes that encode regulatory hubs; (3) the view of adaptive evolution as an optimization process; and (4) the dynamics with which laboratory populations evolve.


Conflict of interest statement

The authors declare that they have no conflict of interest.

Figures

Figure 1
Figure 1
Intragenic mutations identified in E. coli ALE studies. (A) Single-nucleotide substitutions, insertions, and deletions found within the open reading frames by whole-genome sequencing in multiple E. coli ALE studies (Herring et al, 2006; Barrick et al, 2009; Conrad et al, 2009; Charusanti et al, 2010; Kishimoto et al, 2010; Lee and Palsson, 2010) are shown on a circular representation of the E. coli chromosome. (B) The set of genes displayed on the E. coli chromosome was subjected to enrichment analysis for Gene Ontology Slim (GOslim) categories (Camon et al, 2004). Wedges that protrude outward represent statistically enriched GOslim categories (also marked by ** in the legend). (C) Genes that were mutated in multiple studies are shown. 20K=growth on glucose minimal medium for 20 000 generations (Barrick and Lenski, 2009), 45A=adaptation to high temperature (Kishimoto et al, 2010), ETM=adaptation of ethanol tolerance (Goodarzi et al, 2009), Glyc=growth on glycerol minimal medium (Herring et al, 2006), Lact=growth on lactate minimal media (Conrad et al, 2009), and PGI=growth on glucose minimal media following the deletion of pgi (Charusanti et al, 2010).
Figure 2
Figure 2
Optimality principles in adaptive evolution. (A) A smooth fitness landscape consisting of a single peak. Circles represent points on the landscape and arrows indicate the pathway of genetic change through the landscape. On a smooth landscape, there is a tendency for evolutionary convergence toward the single optimum, regardless of the starting point on the landscape. (B) A rough fitness landscape consists of multiple peaks. With multiple optima, there tends to be evolutionary divergence, sometimes even when starting from the same location on the landscape. (C) A phenotypic phase plane is a representation of how two fluxes in a metabolic network relate to each other and affect in silico-predicted optimal growth. Distinct planes are represented by several colors. Here, the line of optimality (LO, yellow) defines the ratio of glycerol uptake rate to oxygen uptake rate that leads to optimal biomass production. On glycerol, wild-type E. coli initially has a phenotype that maps to a suboptimal region of the portrait. After a growing for several hundred generations on glycerol, the E. coli phenotype migrates to the line of optimality. (D) Optimality principles can used to design strains of bacteria in which growth at the maximal rate requires the secretion of a product of interest. When subjected to ALE, the designed strains increase both their growth rate and product secretion rate. The two colored regions indicate accessible flux states before and after evolution.
Figure 3
Figure 3
Simulation of the evolution dynamics of an rpoC mutant. Exponential growth in the number of cells N at time t is given by the function N(t)=N0ekt where N0 represents N at t=0 and k represents the growth rate. (A) The fraction of the population represented by an rpoC mutant (krpoC=0.43) in an otherwise wild-type population (kwt=0.27) and which initially exists at a ratio of one rpoC mutant cell per 2 × 10⁸ wild-type cells is shown. (B) The scenario in this graph is the same as before, except initially the one rpoC mutant (blue) cell exists in a population of 108 cells that is 95% wild-type and 5% glpK mutant (red, kmut=0.35). This situation results in a situation of clonal interference between two beneficial alleles.

Similar articles

Cited by

References

    1. Albert TJ, Dailidiene D, Dailide G, Norton JE, Kalia A, Richmond TA, Molla M, Singh J, Green RD, Berg DE (2005) Mutation discovery in bacterial genomes: metronidazole resistance in Helicobacter pylori. Nat Methods 2: 951–953 - PubMed
    1. Applebee MK, Herrgard MJ, Palsson BO (2008) Impact of individual mutations on increased fitness in adaptively evolved strains of Escherichia coli. J Bacteriol 190: 5087–5094 - PMC - PubMed
    1. Araya CL, Payen C, Dunham MJ, Fields S (2010) Whole-genome sequencing of a laboratory-evolved yeast strain. BMC Genomics 11: 88. - PMC - PubMed
    1. Arjan JA, Visser M, Zeyl CW, Gerrish PJ, Blanchard JL, Lenski RE (1999) Diminishing returns from mutation supply rate in asexual populations. Science (New York, NY) 283: 404–406 - PubMed
    1. Atsumi S, Wu TY, Machado IM, Huang WC, Chen PY, Pellegrini M, Liao JC (2010) Evolution, genomic analysis, and reconstruction of isobutanol tolerance in Escherichia coli. Mol Syst Biol 6: 449. - PMC - PubMed

Publication types