Genomic imbalances in esophageal carcinoma cell lines involve Wnt pathway genes
- PMID: 21734802
- PMCID: PMC3129505
- DOI: 10.3748/wjg.v17.i24.2909
Genomic imbalances in esophageal carcinoma cell lines involve Wnt pathway genes
Abstract
Aim: To identify molecular markers shared across South African esophageal squamous cell carcinoma (ESCC) cell lines using cytogenetics, fluorescence in situ hybridization (FISH) and single nucleotide polymorphism (SNP) array copy number analysis.
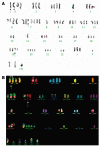
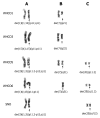
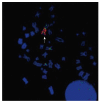
Methods: We used conventional cytogenetics, FISH, and multicolor FISH to characterize the chromosomal rearrangements of five ESCC cell lines established in South Africa. The whole genome copy number profile was established from 250K SNP arrays, and data was analyzed with the CNAT 4.0 and GISTIC software.
Results: We detected common translocation breakpoints involving chromosomes 1p11-12 and 3p11.2, the latter correlated with the deletion, or interruption of the EPHA3 gene. The most significant amplifications involved the following chromosomal regions and genes: 11q13.3 (CCND1, FGF3, FGF4, FGF19, MYEOV), 8q24.21(C-MYC, FAM84B), 11q22.1-q22.3 (BIRC2, BIRC3), 5p15.2 (CTNND2), 3q11.2-q12.2 (MINA) and 18p11.32 (TYMS, YES1). The significant deletions included 1p31.2-p31.1 (CTH, GADD45α, DIRAS3), 2q22.1 (LRP1B), 3p12.1-p14.2 (FHIT), 4q22.1-q32.1 (CASP6, SMAD1), 8p23.2-q11.1 (BNIP3L) and 18q21.1-q21.2 (SMAD4, DCC). The 3p11.2 translocation breakpoint was shared across four cell lines, supporting a role for genes involved at this site, in particular, the EPHA3 gene which has previously been reported to be deleted in ESCC.
Conclusion: The finding that a significant number of genes that were amplified (FGF3, FGF4, FGF19, CCND1 and C-MYC) or deleted (SFRP2 gene) are involved in the Wnt and fibroblast growth factor signaling pathways, suggests that these pathways may be activated in these cell lines.
Keywords: Cancer; Esophagus; Fluorescent in situ hybridization; Single nucleotide polymorphism arrays.
Figures


Similar articles
-
Landscape of copy number aberrations in esophageal squamous cell carcinoma from a high endemic region of South Africa.BMC Cancer. 2020 Apr 6;20(1):281. doi: 10.1186/s12885-020-06788-3. BMC Cancer. 2020. PMID: 32252688 Free PMC article.
-
Characterization of genetic rearrangements in esophageal squamous carcinoma cell lines by a combination of M-FISH and array-CGH: further confirmation of some split genomic regions in primary tumors.BMC Cancer. 2012 Aug 24;12:367. doi: 10.1186/1471-2407-12-367. BMC Cancer. 2012. PMID: 22920630 Free PMC article.
-
Genome-wide analysis of chromosomal alterations in patients with esophageal squamous cell carcinoma exposed to tobacco and betel quid from high-risk area in India.Mutat Res. 2010 Feb;696(2):130-8. doi: 10.1016/j.mrgentox.2010.01.001. Epub 2010 Jan 18. Mutat Res. 2010. PMID: 20083228
-
WNT and FGF gene clusters (review).Int J Oncol. 2002 Dec;21(6):1269-73. Int J Oncol. 2002. PMID: 12429977 Review.
-
[Identification of the breakpoint-flanking markers on chromosomes 1 and 17 of a constitutional translocation T(1;17)(P36;Q12-21) in a patient with neuroblastoma].Verh K Acad Geneeskd Belg. 1995;57(5):389-422. Verh K Acad Geneeskd Belg. 1995. PMID: 8571670 Review. Dutch.
Cited by
-
Pilot genome-wide study of tandem 3' UTRs in esophageal cancer using high-throughput sequencing.Mol Med Rep. 2014 May;9(5):1597-605. doi: 10.3892/mmr.2014.2003. Epub 2014 Mar 4. Mol Med Rep. 2014. PMID: 24604236 Free PMC article.
-
A Novel Role for the Tumor Suppressor Gene ITF2 in Tumorigenesis and Chemotherapy Response.Cancers (Basel). 2020 Mar 26;12(4):786. doi: 10.3390/cancers12040786. Cancers (Basel). 2020. PMID: 32224864 Free PMC article.
-
Oncogenic function of SCCRO5/DCUN1D5 requires its Neddylation E3 activity and nuclear localization.Clin Cancer Res. 2014 Jan 15;20(2):372-81. doi: 10.1158/1078-0432.CCR-13-1252. Epub 2013 Nov 5. Clin Cancer Res. 2014. PMID: 24192928 Free PMC article.
-
Revealing Fibrosis Genes as Biomarkers of Ulcerative Colitis: A Bioinformatics Study Based on ScRNA and Bulk RNA Datasets.Endocr Metab Immune Disord Drug Targets. 2025;25(9):710-720. doi: 10.2174/0118715303332155240912050838. Endocr Metab Immune Disord Drug Targets. 2025. PMID: 39428941 Free PMC article.
-
Genome-wide screening for genetic alterations in esophageal cancer by aCGH identifies 11q13 amplification oncogenes associated with nodal metastasis.PLoS One. 2012;7(6):e39797. doi: 10.1371/journal.pone.0039797. Epub 2012 Jun 25. PLoS One. 2012. PMID: 22761904 Free PMC article.
References
-
- Somdyala NI, Bradshaw D, Gelderblom WC, Parkin DM. Cancer incidence in a rural population of South Africa, 1998-2002. Int J Cancer. 2010;127:2420–2429. - PubMed
-
- Hendricks D, Parker MI. Oesophageal cancer in Africa. IUBMB Life. 2002;53:263–268. - PubMed
-
- van Rensburg SJ. Oesophageal cancer risk factors common to endemic regions. S Afr Med J. 1987;Suppl:9–11. - PubMed
-
- Kamangar F, Malekzadeh R, Dawsey SM, Saidi F. Esophageal cancer in Northeastern Iran: a review. Arch Iran Med. 2007;10:70–82. - PubMed
-
- Marasas WF, van Rensburg SJ, Mirocha CJ. Incidence of Fusarium species and the mycotoxins, deoxynivalenol and zearalenone, in corn produced in esophageal cancer areas in Transkei. J Agric Food Chem. 1979;27:1108–1112. - PubMed
Publication types
MeSH terms
Substances
Grants and funding
LinkOut - more resources
Full Text Sources
Medical
Research Materials
Miscellaneous

