Beta-zone parapapillary atrophy and multifocal visual evoked potentials in eyes with glaucomatous optic neuropathy
- PMID: 21735265
- PMCID: PMC4469993
- DOI: 10.1007/s10633-011-9280-3
Beta-zone parapapillary atrophy and multifocal visual evoked potentials in eyes with glaucomatous optic neuropathy
Abstract
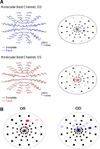
We investigated changes in multifocal visual evoked potential (mfVEP) responses due to beta-zone parapapillary atrophy (ßPPA). Patients with glaucomatous optic neuropathy (GON) with or without standard achromatic perimetry (SAP) abnormalities were referred for mfVEP testing during a 2-year period. Eyes with good quality optic disc stereophotographs and reliable SAP results were included. The mfVEP monocular mean latency delays (ms) and amplitudes (SNR) were analyzed. Age, SAP mean deviation (MD), pattern standard deviation (PSD), and spherical equivalent (SE) were analyzed in the multivariate model. Generalized estimated equations were used for comparisons between groups after adjusting for inter-eye associations. Of 394 eyes of 200 patients, 223 (57%) had ßPPA. The ßPPA eyes were older (59.6 ± 13.7 vs. 56.5 ± 13.7 year, P = 0.02), more myopic (-4.0 ± 3.5 vs. -1.3 ± 3.5 D, P < 0.01), and had poorer SAP scores (MD: -4.9 ± 5.2 vs. -2.6 ± 5.2 dB, P < 0.01; PSD: 4.3 ± 2.9 vs. 2.5 ± 3.0 dB, P < 0.01). By univariate analysis, mean latencies were longer in ßPPA eyes (6.1 ± 5.3 vs. 4.0 ± 5.5 ms, P < 0.01). After adjusting for differences in SE, age, and SAP MD, there was no significant difference between the two groups (P = 0.09). ßPPA eyes had lower amplitude log SNR (0.49 ± 0.16 vs. 0.56 ± 0.15, P < 0.01), which lost significance (P = 0.51) after adjusting for MD and PSD. Although eyes with ßPPA had significantly lower amplitudes and prolonged latencies than eyes without ßPPA, these differences were attributable to differences in SAP severity, age, and refractive error. Thus, ßPPA does not appear to be an independent factor affecting mfVEP responses in eyes with GON.
Conflict of interest statement
Figures


Similar articles
-
Comparing multifocal VEP and standard automated perimetry in high-risk ocular hypertension and early glaucoma.Invest Ophthalmol Vis Sci. 2007 Mar;48(3):1173-80. doi: 10.1167/iovs.06-0561. Invest Ophthalmol Vis Sci. 2007. PMID: 17325161
-
Clinical use of multifocal visual-evoked potentials in a glaucoma practice: a prospective study.Doc Ophthalmol. 2012 Aug;125(1):1-9. doi: 10.1007/s10633-012-9324-3. Epub 2012 Apr 5. Doc Ophthalmol. 2012. PMID: 22476612 Free PMC article.
-
Evaluation of the visual function in obstructive sleep apnea syndrome patients and normal-tension glaucoma by means of the multifocal visual evoked potentials.Graefes Arch Clin Exp Ophthalmol. 2012 Nov;250(11):1681-8. doi: 10.1007/s00417-012-1982-z. Epub 2012 Mar 14. Graefes Arch Clin Exp Ophthalmol. 2012. PMID: 22411129
-
[New insights into the pathogenesis of glaucomatous optic neuropathy and refinement of the objective assessment of its functional damage].Nippon Ganka Gakkai Zasshi. 2012 Mar;116(3):298-344; discussion 345-6. Nippon Ganka Gakkai Zasshi. 2012. PMID: 22568105 Review. Japanese.
-
Multifocal VEP and ganglion cell damage: applications and limitations for the study of glaucoma.Prog Retin Eye Res. 2003 Mar;22(2):201-51. doi: 10.1016/s1350-9462(02)00061-7. Prog Retin Eye Res. 2003. PMID: 12604058 Review.
References
-
- Weinreb RN, Khaw PT. Primary open-angle glaucoma. Lancet. 2004;363:1711–1720. - PubMed
-
- Susanna R, Jr, Vessani RM. New findings in the evaluation of the optic disc in glaucoma diagnosis. Curr Opin Ophthalmol. 2007;18:122–128. - PubMed
-
- Elschnig A. Das Colobom am Sehnerveneintritte und der Conus nach unten. Arch Ophthalmol. 1900;51:391–430.
-
- Jonas JB, Nguyen XN, Gusek GC, Naumann GO. Parapapillary chorioretinal atrophy in normal and glaucoma eyes. I. Morphometric data. Invest Ophthalmol Vis Sci. 1989;30:908–918. - PubMed
-
- Jonas JB, Naumann GO. Parapapillary chorioretinal atrophy in normal and glaucoma eyes. II. Correlations. Invest Ophthalmol Vis Sci. 1989;30:919–926. - PubMed
Publication types
MeSH terms
Grants and funding
LinkOut - more resources
Full Text Sources
Medical
Miscellaneous

