. 2011 Nov;20(4):387-401.
doi: 10.1007/s12640-011-9255-x. Epub 2011 Jul 7.

Dopamine and paraquat enhance α-synuclein-induced alterations in membrane conductance

Affiliations

Dopamine and paraquat enhance α-synuclein-induced alterations in membrane conductance

Li Rebekah Feng et al. Neurotox Res. 2011 Nov.

Abstract

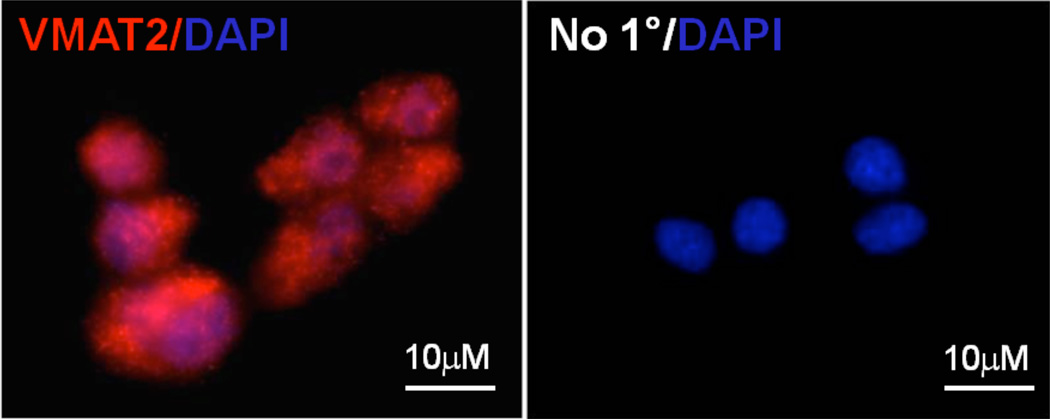
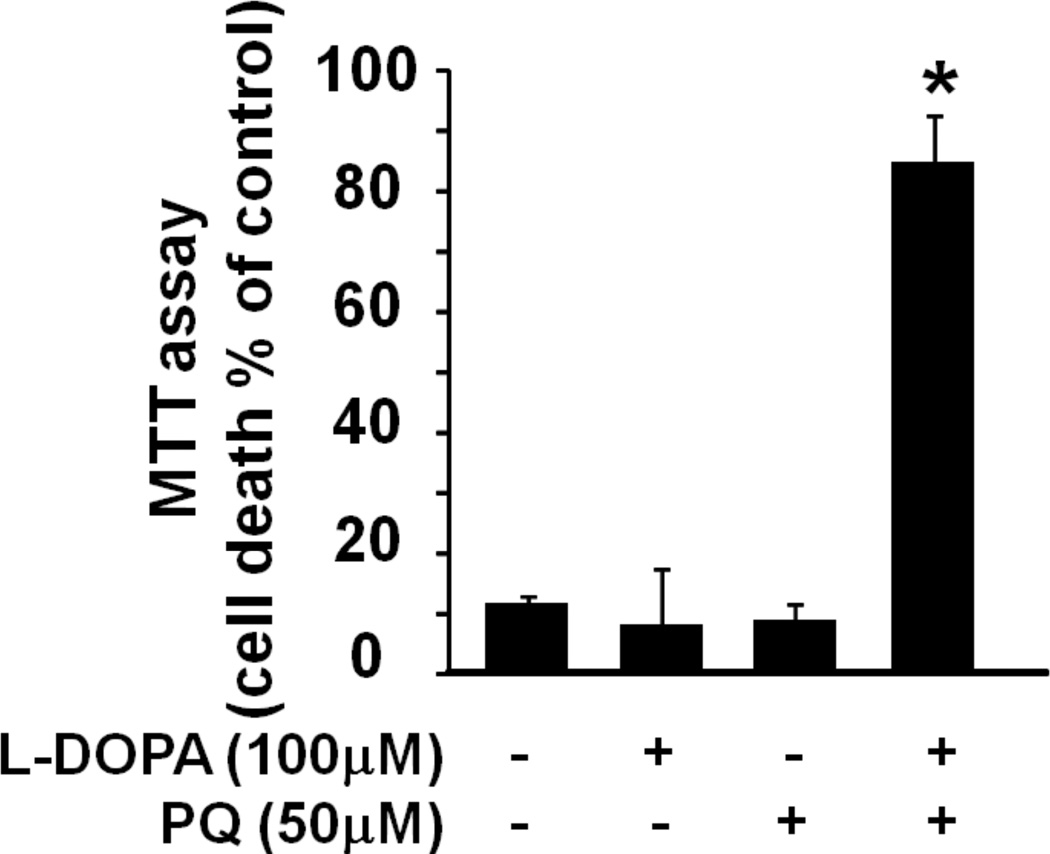
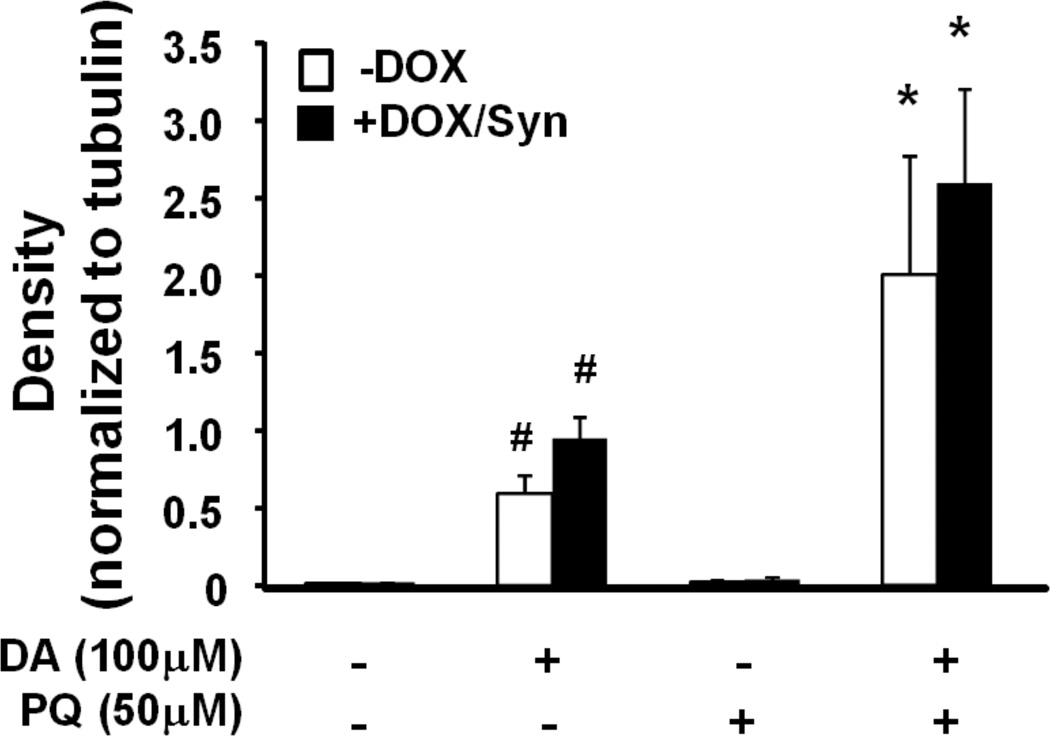
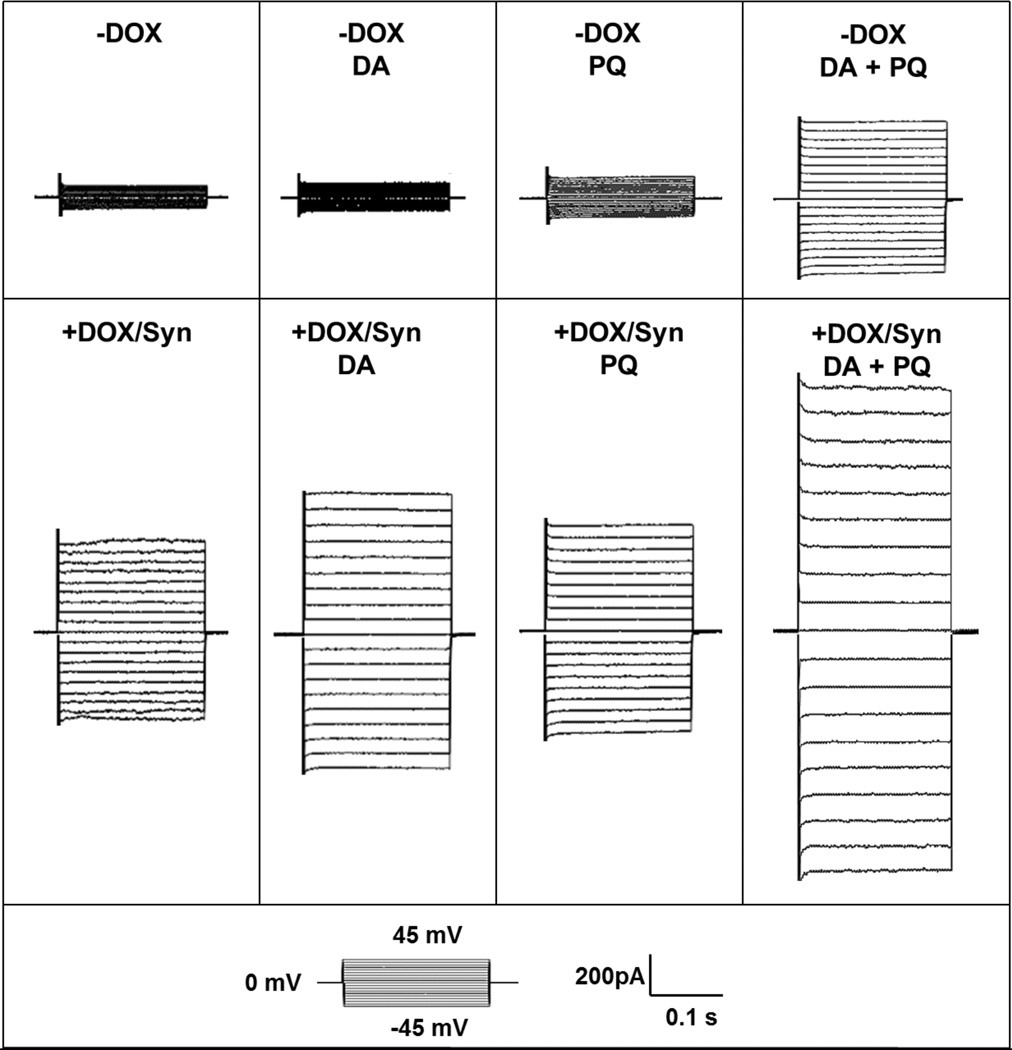
We have previously demonstrated that α-synuclein overexpression increases the membrane conductance of dopaminergic-like cells. Although α-synuclein is thought to play a central role in the pathogenesis of several neurodegenerative diseases including Parkinson's disease, multiple system atrophy, and diffuse Lewy body disease, the mechanism of action is not completely understood. In this study, we sought to determine whether multiple factors act together with α-synuclein to engender cell vulnerability through an augmentation of membrane conductance. In this article, we employed a cell model that mimics dopaminergic neurons coupled with α-synuclein overexpression and oxidative stressors. We demonstrate an enhancement of α-synuclein-induced toxicity in the presence of combined treatment with dopamine and paraquat, two molecules known to incite oxidative stress. In addition, we show that combined dopamine and paraquat treatment increases the expression of heme oxygenase-1, an antioxidant response protein. Finally, we demonstrate for the first time that combined treatment of dopaminergic cells with paraquat and dopamine enhances α-synuclein-induced leak channel properties resulting in increased membrane conductance. Importantly, these increases are most robust when both paraquat and dopamine are present suggesting the need for multiple oxidative insults to augment α-synuclein-induced disruption of membrane integrity.


Figures

Fig. 1
Fig. 1
Expression of α-synuclein and markers of dopaminergic neurons in MN9Dsyn cells. (a) Representative western blots of MN9Dsyn cell lysates (20 µg / lane) demonstrating the presence of dopaminergic neuron markers, tyrosine hydroxylase (TH) and dopamine transporter (DAT). (b) Representative image of MN9Dsyn cells immunostained for vesicular monoamine transporter 2 (VMAT2; red) and subsequently stained with DAPI to visualize nuclei (blue) (left panel). No primary antibody control counterstained with DAPI (right panel). (c) Representative western blots of MN9Dsyn lysates (20 µg protein / lane) immunoblotted for α-synuclein and reprobed for α-tubulin as a loading control. Administration of doxycycline (+DOX) induces robust α-synuclein overexpression (+DOX) compared to uninduced MN9Dsyn (−DOX).
Fig. 1
Fig. 1
Expression of α-synuclein and markers of dopaminergic neurons in MN9Dsyn cells. (a) Representative western blots of MN9Dsyn cell lysates (20 µg / lane) demonstrating the presence of dopaminergic neuron markers, tyrosine hydroxylase (TH) and dopamine transporter (DAT). (b) Representative image of MN9Dsyn cells immunostained for vesicular monoamine transporter 2 (VMAT2; red) and subsequently stained with DAPI to visualize nuclei (blue) (left panel). No primary antibody control counterstained with DAPI (right panel). (c) Representative western blots of MN9Dsyn lysates (20 µg protein / lane) immunoblotted for α-synuclein and reprobed for α-tubulin as a loading control. Administration of doxycycline (+DOX) induces robust α-synuclein overexpression (+DOX) compared to uninduced MN9Dsyn (−DOX).
Fig. 2
Fig. 2
Treatment with dopamine and paraquat augments α-synuclein-induced cell death. (a) Representative images of MN9Dsyn cells overexpressing α-synuclein (+DOX/Syn) and treated with vehicle (Syn), dopamine (DA), paraquat (PQ) or both following immunocytochemistry for α-synuclein (red). Membrane localized, nuclear and cytosolic α-synuclein as well as aggregates (white arrows) are present in the α-synuclein overexpressing cells. DAPI (blue) was used to visualize the nuclei. Scale bar = 25 µm. Syn-specific aggregates are more apparent in the higher magnification inset photomicrograph (white box; arrow; scale bar = 10 µm). Cell loss and shrunken / punctate nuclei are evident in Syn-overexpressing cells treated with both DA and PQ (Syn + DA + PQ). (b) MTT assay of MN9Dsyn cells treated with DA (100 µM), PQ (50 µM), or both. Cell death was calculated as the percentage of mitochondrial activity reduction following α-synuclein overexpression (+DOX/Syn) as compared with uninduced (−DOX) controls for the same treatment group (DA, PQ, or both). Values are expressed as percent cell death ± SEM (N = 8 wells/treatment). Each experiment was repeated at least three times. One-way ANOVA and Tukey HSD post-hoc test, *Significant difference as compared with untreated controls, P < 0.05. Syn overexpression alone resulted in 9% cell death; treatment with DA or PQ resulted in 32.1% [(+DOX) vs. (+DOX+DA) *P = 6×10⁻⁵] and 4.5% [(+DOX) vs. (+DOX+PQ) P = 0.79)] cell death respectively; treatment with both DA and PQ induced 82.2% cell death [(+DOX) vs. (+DOX+DA+PQ) **P = 5×10⁻¹³; (+DOX+DA) vs. (+DOX+DA+PQ) #P = 5×10⁻¹³). (c) MTT assay of MN9Dsyn cells in the presence and absence of DOX treated with L-DOPA (100 µM), PQ (50 µM), or both. Cell death was calculated as the percentage of mitochondrial activity reduction following Syn overexpression (+DOX/Syn) as compared with uninduced (×DOX) controls for the same treatment group (L-DOPA, PQ, or both). One-way ANOVA and Tukey HSD post-hoc test, *Significant difference as compared with untreated controls, P < 0.05. Treatment with L-DOPA or PQ resulted in 8.2% [(+DOX) vs. (+DOX+L-DOPA) *P = 0.98] and 8.8% [(+DOX) vs. (+DOX+PQ) P = 0.99)] cell death respectively; treatment with both L-DOPA and PQ induced 84.8% cell death [(+DOX) vs. (+DOX+L-DOPA+PQ) **P = 1.16×10⁻⁵). In the absence of Syn overexpression dopamine (100 µM) and paraquat (50 µM) induced 42% and 12.7% cell death respectively (data not shown).
Fig. 2
Fig. 2
Treatment with dopamine and paraquat augments α-synuclein-induced cell death. (a) Representative images of MN9Dsyn cells overexpressing α-synuclein (+DOX/Syn) and treated with vehicle (Syn), dopamine (DA), paraquat (PQ) or both following immunocytochemistry for α-synuclein (red). Membrane localized, nuclear and cytosolic α-synuclein as well as aggregates (white arrows) are present in the α-synuclein overexpressing cells. DAPI (blue) was used to visualize the nuclei. Scale bar = 25 µm. Syn-specific aggregates are more apparent in the higher magnification inset photomicrograph (white box; arrow; scale bar = 10 µm). Cell loss and shrunken / punctate nuclei are evident in Syn-overexpressing cells treated with both DA and PQ (Syn + DA + PQ). (b) MTT assay of MN9Dsyn cells treated with DA (100 µM), PQ (50 µM), or both. Cell death was calculated as the percentage of mitochondrial activity reduction following α-synuclein overexpression (+DOX/Syn) as compared with uninduced (−DOX) controls for the same treatment group (DA, PQ, or both). Values are expressed as percent cell death ± SEM (N = 8 wells/treatment). Each experiment was repeated at least three times. One-way ANOVA and Tukey HSD post-hoc test, *Significant difference as compared with untreated controls, P < 0.05. Syn overexpression alone resulted in 9% cell death; treatment with DA or PQ resulted in 32.1% [(+DOX) vs. (+DOX+DA) *P = 6×10⁻⁵] and 4.5% [(+DOX) vs. (+DOX+PQ) P = 0.79)] cell death respectively; treatment with both DA and PQ induced 82.2% cell death [(+DOX) vs. (+DOX+DA+PQ) **P = 5×10⁻¹³; (+DOX+DA) vs. (+DOX+DA+PQ) #P = 5×10⁻¹³). (c) MTT assay of MN9Dsyn cells in the presence and absence of DOX treated with L-DOPA (100 µM), PQ (50 µM), or both. Cell death was calculated as the percentage of mitochondrial activity reduction following Syn overexpression (+DOX/Syn) as compared with uninduced (×DOX) controls for the same treatment group (L-DOPA, PQ, or both). One-way ANOVA and Tukey HSD post-hoc test, *Significant difference as compared with untreated controls, P < 0.05. Treatment with L-DOPA or PQ resulted in 8.2% [(+DOX) vs. (+DOX+L-DOPA) *P = 0.98] and 8.8% [(+DOX) vs. (+DOX+PQ) P = 0.99)] cell death respectively; treatment with both L-DOPA and PQ induced 84.8% cell death [(+DOX) vs. (+DOX+L-DOPA+PQ) **P = 1.16×10⁻⁵). In the absence of Syn overexpression dopamine (100 µM) and paraquat (50 µM) induced 42% and 12.7% cell death respectively (data not shown).
Fig. 3
Fig. 3
Dopamine in combination with paraquat increase heme oxygenase-1 expression. (a) Representative western blots illustrating upregulation of heme oxygenase-1 (HO-1) protein levels in MN9Dsyn cells (± DOX) treated with dopamine (DA), and dopamine plus paraquat (PQ). Samples (20 µg protein / lane) were immunoblotted for HO-1. The same blots were subsequently stripped and reprobed for α-tubulin as a loading control. (b) HO-1 immunoprotein complexes were quantified by densitometric analysis of western blots and values normalized to α-tubulin. Values are expressed as mean band intensity ± SEM from six samples/treatment. One-way ANOVA and Tukey HSD post-hoc test, *significant difference as compared with untreated controls, P < 0.05. Only cells treated with both DA and PQ demonstrated a significant increase in HO-1 protein levels. [ANOVA, *significance as compared to non-treated control: (+DA+PQ) P = 0.006, (+DOX+DA+PQ) P = 0.00017]. HO-1 protein levels were increased to a lesser extent in cells treated with DA alone as compared to non-treated control (statistically insignificant by ANOVA with Tukey HSD post-hoc test; #P < 0.05 significant by paired t-test with Bonferroni adjustment).
Fig. 3
Fig. 3
Dopamine in combination with paraquat increase heme oxygenase-1 expression. (a) Representative western blots illustrating upregulation of heme oxygenase-1 (HO-1) protein levels in MN9Dsyn cells (± DOX) treated with dopamine (DA), and dopamine plus paraquat (PQ). Samples (20 µg protein / lane) were immunoblotted for HO-1. The same blots were subsequently stripped and reprobed for α-tubulin as a loading control. (b) HO-1 immunoprotein complexes were quantified by densitometric analysis of western blots and values normalized to α-tubulin. Values are expressed as mean band intensity ± SEM from six samples/treatment. One-way ANOVA and Tukey HSD post-hoc test, *significant difference as compared with untreated controls, P < 0.05. Only cells treated with both DA and PQ demonstrated a significant increase in HO-1 protein levels. [ANOVA, *significance as compared to non-treated control: (+DA+PQ) P = 0.006, (+DOX+DA+PQ) P = 0.00017]. HO-1 protein levels were increased to a lesser extent in cells treated with DA alone as compared to non-treated control (statistically insignificant by ANOVA with Tukey HSD post-hoc test; #P < 0.05 significant by paired t-test with Bonferroni adjustment).
Fig. 4
Fig. 4
Oxidative stress increases membrane permeability in α-synuclein overexpressing cells. (a) Representative traces from α-synuclein overexpressing (+DOX/Syn) and uninduced (−DOX) MN9Dsyn cells treated with ± DA ± PQ showing currents elicited by stepping membrane voltage from a holding potential of 0 mV to levels between −45 mV and 45 mV (inset: step voltage protocol). (b) Percent conductance change from α-synuclein overexpressing (+DOX/Syn) and uninduced (−DOX) MN9Dsyn cells treated with ± DA ± PQ. Data were normalized to control α-synuclein-overexpressing MN9Dsyn cells to reflect the percent changes in membrane conductance as a result of various treatments. Values are expressed as percent conductance ± SEM (N = 9–20 cells/treatment group from four independent experiments). α-Synuclein overexpression (+DOX/Syn) increased membrane conductance [*P < 0.05, one-way ANOVA and paired t-test with Bonferroni adjustment, significant difference as compared with uninduced control; (+DOX/Syn) compared with (−DOX)]. Dopamine or paraquat treatment alone did not increase membrane conductance as compared with the untreated control group either in the uninduced (−DOX) or induced (+DOX/Syn) MN9Dsyn cells [statistically insignificant by ANOVA and paired t-test with Bonferroni adjustment; (−DOX+DA) and (−DOX+PQ) compared with (−DOX); (+DOX+DA) and (+DOX+PQ) compared with (+DOX)]. Combined treatment of dopamine and paraquat resulted in elevated membrane permeability indicating compromised membrane integrity [# P < 0.05, ANOVA and paired t-test with Bonferroni adjustment, (−DOX+DA+PQ) compared with (−DOX)]. Importantly, the combination of α-synuclein overexpression, dopamine and paraquat led to a more robust and significant increase in membrane conductance when compared with any stressor alone [$ P < 0.05, ANOVA and paired t-test with Bonferroni adjustment, (+DOX+DA+PQ) compared with (+DOX)].
Fig. 4
Fig. 4
Oxidative stress increases membrane permeability in α-synuclein overexpressing cells. (a) Representative traces from α-synuclein overexpressing (+DOX/Syn) and uninduced (−DOX) MN9Dsyn cells treated with ± DA ± PQ showing currents elicited by stepping membrane voltage from a holding potential of 0 mV to levels between −45 mV and 45 mV (inset: step voltage protocol). (b) Percent conductance change from α-synuclein overexpressing (+DOX/Syn) and uninduced (−DOX) MN9Dsyn cells treated with ± DA ± PQ. Data were normalized to control α-synuclein-overexpressing MN9Dsyn cells to reflect the percent changes in membrane conductance as a result of various treatments. Values are expressed as percent conductance ± SEM (N = 9–20 cells/treatment group from four independent experiments). α-Synuclein overexpression (+DOX/Syn) increased membrane conductance [*P < 0.05, one-way ANOVA and paired t-test with Bonferroni adjustment, significant difference as compared with uninduced control; (+DOX/Syn) compared with (−DOX)]. Dopamine or paraquat treatment alone did not increase membrane conductance as compared with the untreated control group either in the uninduced (−DOX) or induced (+DOX/Syn) MN9Dsyn cells [statistically insignificant by ANOVA and paired t-test with Bonferroni adjustment; (−DOX+DA) and (−DOX+PQ) compared with (−DOX); (+DOX+DA) and (+DOX+PQ) compared with (+DOX)]. Combined treatment of dopamine and paraquat resulted in elevated membrane permeability indicating compromised membrane integrity [# P < 0.05, ANOVA and paired t-test with Bonferroni adjustment, (−DOX+DA+PQ) compared with (−DOX)]. Importantly, the combination of α-synuclein overexpression, dopamine and paraquat led to a more robust and significant increase in membrane conductance when compared with any stressor alone [$ P < 0.05, ANOVA and paired t-test with Bonferroni adjustment, (+DOX+DA+PQ) compared with (+DOX)].
Fig. 5
Fig. 5
Western blot analysis of α-synuclein protein levels in treated MN9Dsyn cells. (a) MN9Dsyn cells were treated with (+) and without (−) doxcycline (DOX), dopamine (DA) and paraquat (PQ). Protein lysate samples were subjected to 4–16% SDS-PAGE and immunoblotted for α-synuclein. The same blots were subsequently stripped and reprobed for α-tubulin as a loading control. Representative western blots revealing the presence of monomeric and SDS-resistant α-synuclein (Syn) oligomers (vertical line; N = 3 / treatment; 20 µg protein / lane). (b) α-Synuclein immunoprotein complexes were quantified by densitometric analysis of western blots and values normalized to α-tubulin. Values are expressed as mean band intensity ± SEM from three samples and analyzed by one-way ANOVA and Tukey HSD post-hoc test. There was no statistically significant difference in α-synuclein protein levels among the DOX-treated groups.
Fig. 5
Fig. 5
Western blot analysis of α-synuclein protein levels in treated MN9Dsyn cells. (a) MN9Dsyn cells were treated with (+) and without (−) doxcycline (DOX), dopamine (DA) and paraquat (PQ). Protein lysate samples were subjected to 4–16% SDS-PAGE and immunoblotted for α-synuclein. The same blots were subsequently stripped and reprobed for α-tubulin as a loading control. Representative western blots revealing the presence of monomeric and SDS-resistant α-synuclein (Syn) oligomers (vertical line; N = 3 / treatment; 20 µg protein / lane). (b) α-Synuclein immunoprotein complexes were quantified by densitometric analysis of western blots and values normalized to α-tubulin. Values are expressed as mean band intensity ± SEM from three samples and analyzed by one-way ANOVA and Tukey HSD post-hoc test. There was no statistically significant difference in α-synuclein protein levels among the DOX-treated groups.
Fig. 6
Fig. 6
Hypothesized effect of oxidative stress and α-synuclein on membrane integrity. α-Synuclein induces neuronal toxicity by misfolding into pore like structures and increasing membrane conductance (1 & 2). Dopamine and paraquat each contribute to elevated levels of oxidative stress by increasing intracellular levels of ROS (3a & 4). Dopamine auto-oxidizes extracellularly leading to free radical production and consequently compromised membrane integrity (3b). Intracellular oxidative stress also increases membrane leakage through oxidation of the lipid membrane (5; lightning bolt). Importantly, combined treatment of neurons with dopamine and paraquat enhances the α-synuclein-induced effects in part by increasing α-synuclein leak channel conductivity leading to a disruption of ionic imbalance, and eventually cell death (1–5). Cells attempt to compensate for the increased oxidative stress through activation of anti-oxidant response mechanisms including upregulation of heme oxygenase-1 (HO-1; 6-solid line). HO-1 in turn has been shown to inhibit α-synuclein fibrillization (6-dotted line). In our model this anti-oxidant response is not sufficient to inhibit the combined effects of α-synuclein and oxidative stressors.

Similar articles

Cited by

References

    1. Abeliovich A, Schmitz Y, Fariñas I, Choi-Lundberg D, Ho W-H, Castillo PE, Shinsky N, Verdugo JMG, Armanini M, Ryan A, Hynes M, Phillips H, Sulzer D, Rosenthal A. Mice Lacking [alpha]-Synuclein Display Functional Deficits in the Nigrostriatal Dopamine System. Neuron. 2000;25:239–252. - PubMed
    1. Alam ZI, Daniel SE, Lees AJ, Marsden DC, Jenner P, Halliwell B. A Generalised Increase in Protein Carbonyls in the Brain in Parkinson's but Not Incidental Lewy Body Disease. Journal of Neurochemistry. 1997a;69:1326–1329. - PubMed
    1. Alam ZI, Jenner A, Daniel SE, Lees AJ, Cairns N, Marsden CD, Jenner P, Halliwell B. Oxidative DNA Damage in the Parkinsonian Brain: An Apparent Selective Increase in 8-Hydroxyguanine Levels in Substantia Nigra. Journal of Neurochemistry. 1997b;69:1196–1203. - PubMed
    1. Ames BN, Shigenaga MK, Hagen TM. Oxidants, antioxidants, and the degenerative diseases of aging. Proceedings of the National Academy of Sciences of the United States of America. 1993;90:7915–7922. - PMC - PubMed
    1. Auluck PK, Caraveo G, Lindquist S. α-Synuclein: Membrane Interactions and Toxicity in Parkinson's Disease. Annual Review of Cell and Developmental Biology. 2010;26 - PubMed

Publication types

MeSH terms

LinkOut - more resources