. 2011 Nov;26(11):2634-46.
doi: 10.1002/jbmr.465.

Cell line IDG-SW3 replicates osteoblast-to-late-osteocyte differentiation in vitro and accelerates bone formation in vivo

Affiliations

Cell line IDG-SW3 replicates osteoblast-to-late-osteocyte differentiation in vitro and accelerates bone formation in vivo

Stacey M Woo et al. J Bone Miner Res. 2011 Nov.

Abstract

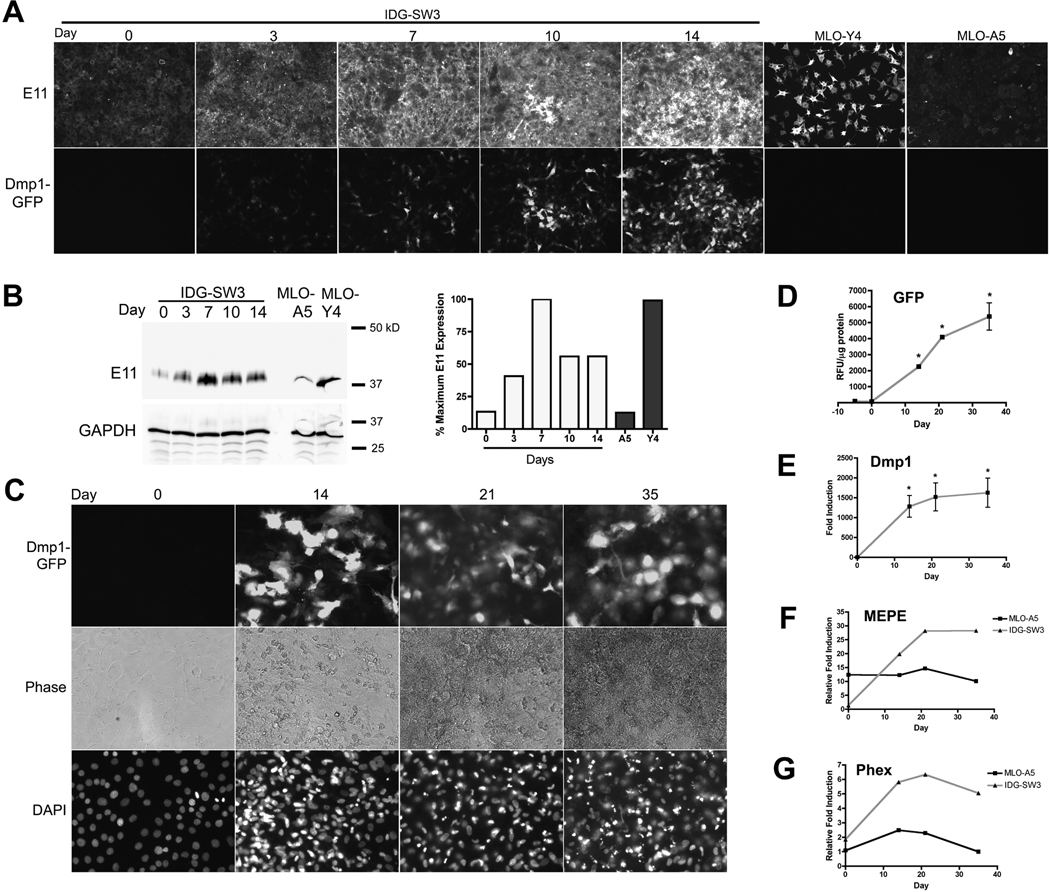
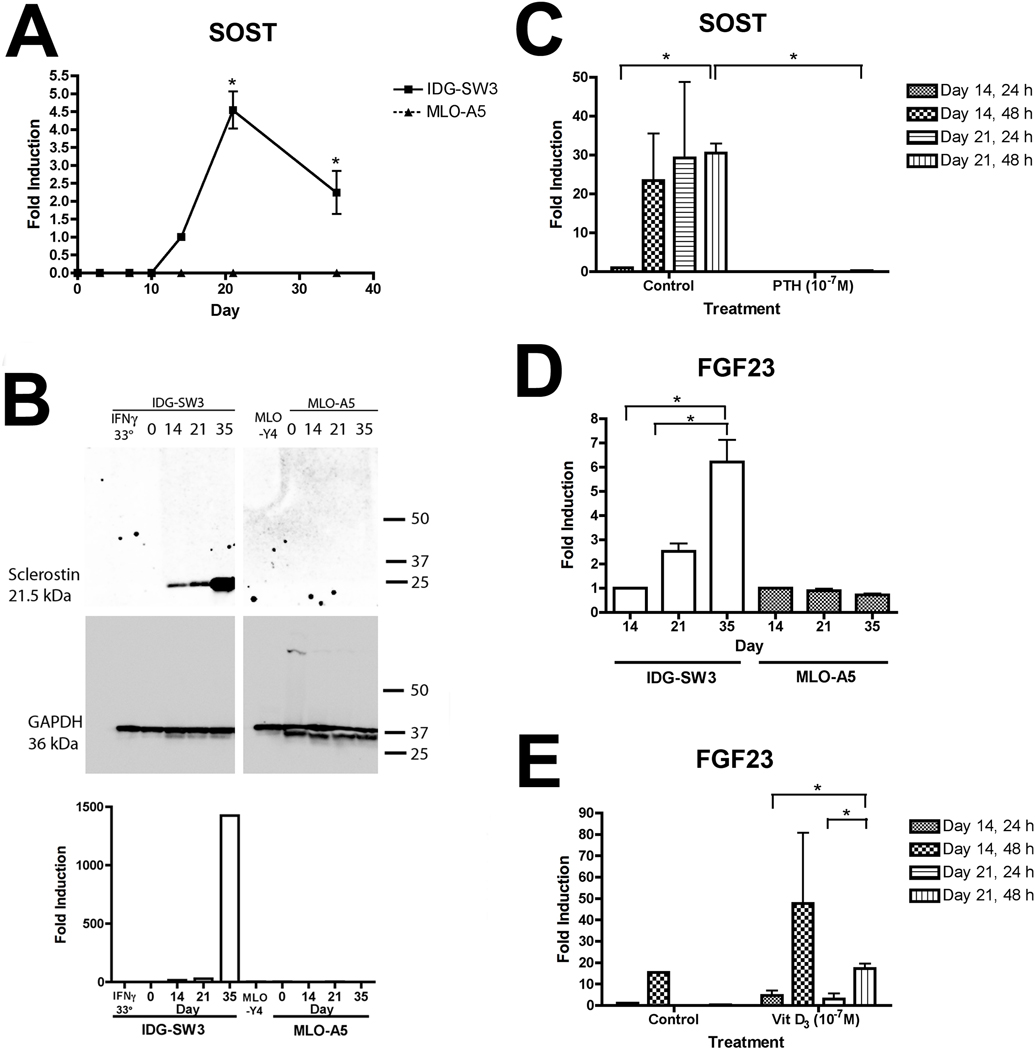
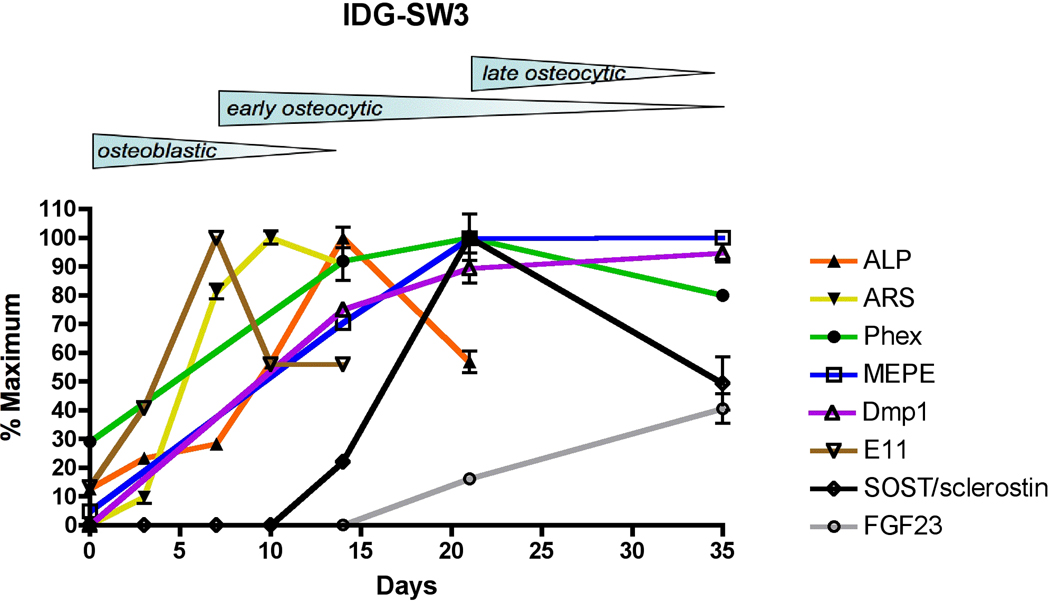
Osteocytes are the most abundant cells in bone yet are the most challenging to study because they are embedded in a mineralized matrix. We generated a clonal cell line called IDG-SW3 (for Immortomouse/Dmp1-GFP-SW3) from long-bone chips from mice carrying a Dmp1 promoter driving GFP crossed with the Immortomouse, which expresses a thermolabile SV40 large T antigen regulated by interferon γ (IFN-γ). Cells from these mice can be expanded at 33 °C in the presence of IFN-γ and then allowed to resume their original phenotype at 37 °C in the absence of IFN-γ. IDG-SW3 cells are Dmp1-GFP(-) and T antigen(+) under immortalizing conditions but Dmp1-GFP(+) and T antigen(-) under osteogenic conditions. Like osteoblasts, they express alkaline phosphatase and produce and mineralize a type 1 collagen matrix containing calcospherulites. Like early osteocytes, they express E11/gp38, Dmp1, MEPE, and Phex. Like late osteocytes, they develop a dendritic morphology and express SOST/sclerostin and fibroblast growth factor 23 (FGF-23), regulated by parathyroid hormone (PTH) and 1,25-dihydroxyvitamin D(3). When cultured on 3D matrices, they express Dmp1-GFP and sclerostin. When the 3D cultures are implanted in calvarial defects in vivo, they accelerate bone healing. This cell line should prove useful for studying osteoblast-to-osteocyte transition, mechanisms for biomineralization, osteocyte function, and regulation of SOST/sclerostin and FGF-23.


Conflict of interest statement

CONFLICT OF INTEREST

All authors have no conflicts of interest.

Figures

Fig. 1
Fig. 1. Dmp1-GFP and T-antigen expression in IDG-SW3 cells in immortalizing or osteogenic conditions
(A) Total protein was isolated from cells cultured in immortalizing conditions or Day 0–14 in osteogenic conditions for Western blot analysis (left). MLO-A5 cells, which constitutively express the large T-antigen driven by the osteocalcin promoter, are a positive control. Relative densitometry of T antigen-positive bands normalized to GAPDH is shown (right). (B) Images of cells under immortalizing conditions (33°C in the presence of IFN-γ) at 10X and 20X fluorescent and phase contrast microscopy. (C) Images of cells after 14 days osteogenic culture at 37°C in the absence of IFN-γ under 4X fluorescent microscopy. (D) Time course of Dmp1-GFP-positive cells from 0–14 days. DAPI-stained cells were imaged under fluorescent and phase contrast microscopy in osteogenic conditions. (E) Relative percent GFP-positive cells were counted in representative fields. (F) Relative GFP expression as normalized to total protein. Lysates were fluorometrically quantitated. Day 0 is the day after plating and when the cells reached 100% confluence. *p<0.05 compared to Day 0
Fig 2
Fig 2. IDG-SW3 expression of osteoblastic markers, mineralized matrix, and calcospherulites on 2D surfaces in vitro
(A) Alkaline phosphatase expression over 21 days. Cell lysates were assayed for ALP activity at 405 nm, normalized to total protein. (B) Collagen expression in IDG-SW3 compared to MLO-A5. Cells cultured in osteogenic media for 9 days were incubated with rabbit serum immunized against type I collagen or non-immune rabbit serum and compared with MLO-A5 cells, previously shown to produce extracellular matrix rich in type I collagen (1). (C) Mineralization by von Kossa staining. Cells were fixed and stained at 0–14 days differentiation. (D) Percent mineralized area increased significantly over time. (E) Alizarin red stain for calcium deposition. (F) Percent calcified area correlates with extracted alizarin red dye. (G) Alizarin red dye quantitation. MLO-A5 cells were cultured for 9 days demonstrated similar mineralization, whereas MLO-Y4 osteocyte-like cells also did not mineralize. (H) Overlaid images for GFP and alizarin red staining (20X) showing GFP-positive cells closely associated with mineral. (I) Comparative secondary and backscatter images show (1,500X or 1,000X) nanospherulites and calcospherultes ranging from a few nanometers (arrows, top) to approximately 10 um in diameter were observed (arrows, bottom). (J) Abundant vesicle budding from the cell membrane (arrows, top) and collagen fiber production (arrows, bottom) were observed (1,000X). *p<0.05 compared to Day 0.
Fig 3
Fig 3. IDG-SW3 expression of early osteocytic markers on 2D surfaces in vitro
(A) Correlation of E11 expression with Dmp1-GFP. Cells were fixed after 14 days osteogenic differentiation and incubated with an E11-specific primary antibody and a Cy3-conjugated secondary antibody. E11 staining was overlaid with GFP expression to evaluate co-localization. MLO-Y4 cells, a positive control, are highly positive for E11. (B) E11/gp38 western blot and quantitation of cell lysates, normalized to GAPDH. Also shown is relative densitometry of E11-positive bands of a representative experiment. MLO-A5 baseline cell lysates were used as a negative control. (C) Time course of Dmp1-GFP-positive cells in extended culture. Cells were fixed from Day 0–35, stained with DAPI, and representative fields were imaged under fluorescent microscopy. (D) Relative GFP expression in extended culture, as normalized to protein. Cell lysates were fluorometrically quantitated. (E) Relative fold induction of Dmp1 mRNA in extended culture. Quantitative RT-PCR analysis of RNA isolated from cells from 0–35 days, normalized to 18S, shows increased Dmp1 mRNA in parallel with GFP levels observed in culture. (F) Relative fold induction of MEPE mRNA and (G) Phex mRNA in IDG-SW3 compared to MLO-A5 by quantitative RT-PCR. *p<0.05 compared to Day 0
Fig 4
Fig 4. IDG-SW3 expression of late osteocytic markers on 2D surfaces in vitro
(A) Relative fold induction of SOST mRNA in IDG-SW3 compared to MLO-A5. Quantitative RT-PCR with a SOST-specific probe, normalized to 18S, was performed on RNA isolated after 0–35 days of osteogenic culture. MLO-A5 cells were used as controls to compare expression levels. (B) Western blot analysis of sclerostin expression. Total protein isolated at 0–35 days demonstrates abundant sclerostin protein. Relative densitometry of sclerostin-positive bands normalized to GAPDH is shown (bottom). MLO-A5 cells did not express detectable sclerostin protein. (C) PTH inhibition of SOST expression. 10 nM PTH(1–34) treatment inhibits SOST expression after 24 or 48 h. (D) FGF23 mRNA expression in IDG-SW3 cells. Quantitative RT-PCR with an FGF23-specific probe, normalized to 18S, performed on IDG-SW3 RNA isolated after 0–35 days osteogenic culture shows low FGF23 expression over time, although levels were still higher than observed in MLO-A5 cells. (E) 1,25-dihydroxyvitamin D3 upregulation of FGF23 expression in IDG-SW3. Treatment with 10 nM 1,25-dihydroxyvitamin D3 upregulates FGF23 expression after 48 h. *n=3, p<0.05
Fig 5
Fig 5. Mineralization, infiltration, and expression of osteocytic markers of 3D collagen matrices in vitro
IDG-SW3 cells penetrating 3D matrices. H&E staining of decalcified, transverse, paraffin-embedded cells cultured on 3D collagen gel (A) or sponge (B) at 4X, 10X, and 20X magnification. Cells within the gel are indicated with arrows. (C) SEM of IDG-SW3 and underlying mineralization on collagen sponge. Secondary SEM and backscatter images are shown. Abundant calcospherulites intercalated with collagen fibers are observed in 3D culture. Magnification is 10,000X. (D) EDS analysis of highly mineralized regions detected in backscatter imaging indicates the presence of mineral containing calcium and phosphorus associated with IDG-SW3 cells in osteogenic culture. (E) Images of cells on 2D compared to 3D collagen sponge and 3D collagen gel. Cells expressed similar Dmp1-GFP levels. (F) Images of cell morphology and dendrites in 3D culture. Osteocyte-selective dendrites are observed in GFP-positive cells in 4X and 10X fluorescent and phase contrast images. (G) Sclerostin expression in 3D culture. Transverse decalcified, paraffin-embedded sections at 10X and 40X were incubated with sclerostin-specific antibodies and stained with DAB to demonstrate sclerostin protein in embedded cells and within the matrix itself after 30 days of osteogenic culture. The majority of the embedded cells showed some staining for sclerostin. Insignificant staining was detected in deeper regions of the matrix or in samples incubated with a non-immune IgG as a negative control.
Fig 6
Fig 6. IDG-SW3 cells accelerate bone healing in vivo
(A) MicroCT reconstruction of bone healing within calvarial defects. Shown are 2D coronal slices and 3D superior and inferior views of calvaria captured from reconstructed images at Week 7. Increased bone formation is seen in defects containing IDG-SW3 cells. (B) MicroCT quantitative analysis of bone healing within defects. Significant bone healing was observed at Week 7 in IDG-SW3-implanted defects. Total volume measured within the defect appears as a single line due to superimposition of all three lines. (C) Fluorescent images of frozen sections of calvarial defects. Dmp1-GFP-positive cells are still detected at the site 7 weeks after implantation, regionally localized with healing bone.
Fig 7
Fig 7. Schematic diagram summarizing osteoblastic and osteocytic markers in IDG-SW3 cells over time
IDG-SW3 cells transition from late osteoblasts to late osteocytes in vitro on both 2D and 3D substrates.

Similar articles

Cited by

References

    1. Barragan-Adjemian C, Nicolella D, Dusevich V, Dallas MR, Eick JD, Bonewald LF. Mechanism by which MLO-A5 late osteoblasts/early osteocytes mineralize in culture: similarities with mineralization of lamellar bone. Calcif Tissue Int. 2006;79(5):340–353. - PMC - PubMed
    1. Bonewald LF. The Amazing Osteocyte. J Bone Miner Res. 2011;26(2):229–238. - PMC - PubMed
    1. Kitase Y, Barragan L, Jiang JX, Johnson ML, Bonewald LF. Mechanical induction of PGE(2) in osteocytes blocks glucocorticoid induced apoptosis through both the beta-catenin and PKA pathways. J Bone Miner Res. 2010 - PMC - PubMed
    1. Robling AG, Bellido T, Turner CH. Mechanical stimulation in vivo reduces osteocyte expression of sclerostin. J Musculoskelet Neuronal Interact. 2006;6(4):354. - PubMed
    1. Gluhak-Heinrich J, Ye L, Bonewald LF, Feng JQ, MacDougall M, Harris SE, Pavlin D. Mechanical loading stimulates dentin matrix protein 1 (DMP1) expression in osteocytes in vivo. J Bone Miner Res. 2003;18(5):807–817. - PubMed

Publication types

MeSH terms