

Intestinal mucosal adherence and translocation of commensal bacteria at the early onset of type 2 diabetes: molecular mechanisms and probiotic treatment
- PMID: 21735552
- PMCID: PMC3265717
- DOI: 10.1002/emmm.201100159
Intestinal mucosal adherence and translocation of commensal bacteria at the early onset of type 2 diabetes: molecular mechanisms and probiotic treatment
Abstract
A fat-enriched diet modifies intestinal microbiota and initiates a low-grade inflammation, insulin resistance and type-2 diabetes. Here, we demonstrate that before the onset of diabetes, after only one week of a high-fat diet (HFD), live commensal intestinal bacteria are present in large numbers in the adipose tissue and the blood where they can induce inflammation. This translocation is prevented in mice lacking the microbial pattern recognition receptors Nod1 or CD14, but overtly increased in Myd88 knockout and ob/ob mouse. This 'metabolic bacteremia' is characterized by an increased co-localization with dendritic cells from the intestinal lamina propria and by an augmented intestinal mucosal adherence of non-pathogenic Escherichia coli. The bacterial translocation process from intestine towards tissue can be reversed by six weeks of treatment with the probiotic strain Bifidobacterium animalis subsp. lactis 420, which improves the animals' overall inflammatory and metabolic status. Altogether, these data demonstrate that the early onset of HFD-induced hyperglycemia is characterized by an increased bacterial translocation from intestine towards tissues, fuelling a continuous metabolic bacteremia, which could represent new therapeutic targets.
Copyright © 2011 EMBO Molecular Medicine.
Figures
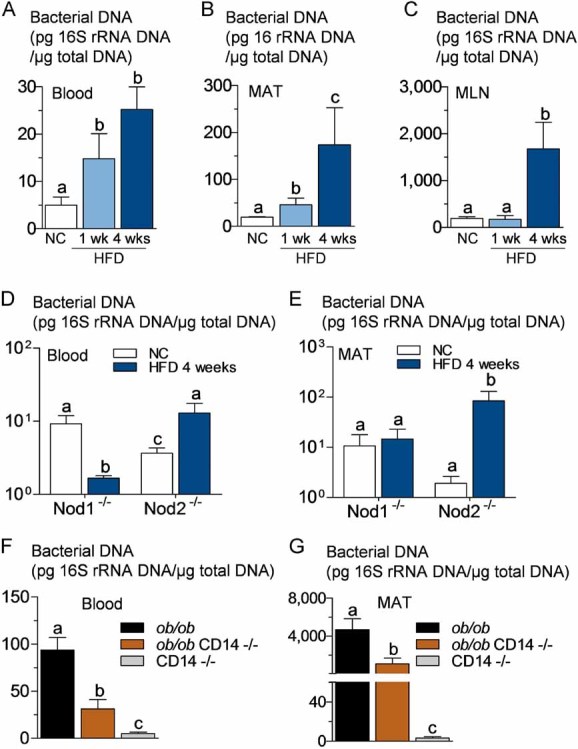
A,B,C. From total bacteria in blood (A), MAT (B) and MLN (C) of normal chow (NC)-fed, prediabetic (HFD 1 week), and diabetic mice (HFD 4 weeks) (mean ± SEM; n = 8).
D,E. From total bacteria in blood (D), and MAT (E) of Nod1-deficient mice (Nod1−/−), and Nod2-deficient mice (Nod2−/−), after 4 weeks of a normal chow (NC) or a high-fat diet (HFD 4 weeks) (mean ± SEM; n = 11).
F,G. From total bacteria in blood (F), and MAT (G), of ob/ob, ob/obxCD14−/−, and CD14−/− mice (all NC-fed) (mean ± SEM; n = 8).
Data with identical superscript letters (A–G) do not differ from each other with p > 0.05.
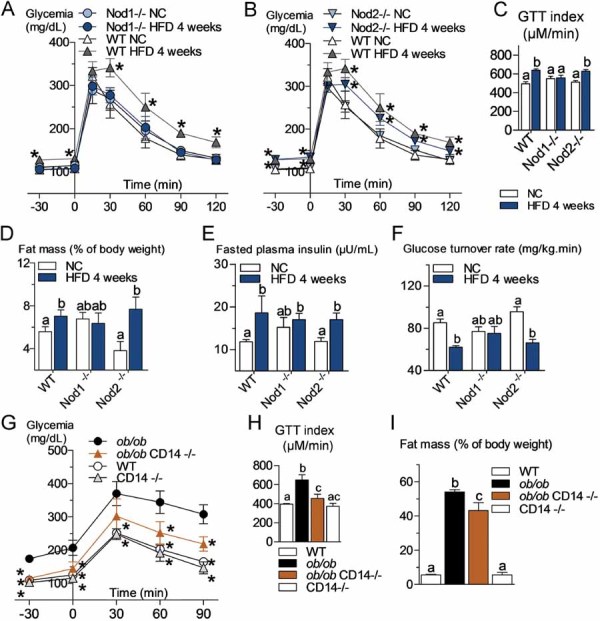
A,B,C. Oral glucose tolerance test (OGTT) (1.5 g/kg) in Nod1-deficient mice (Nod1−/−) (A), Nod2-deficient mice (Nod2−/−) (B) and their corresponding wild-type controls (WT) after 4 weeks of a normal chow (NC) or a high-fat diet (HFD) and corresponding index (µM/min) from 15 to 120 min after glucose administration (C) (mean ± SEM; n = 11; *p < 0.05; data with identical superscript letters do not differ from each other with p > 0.05).
D,E,F. Fat mass (% of body weight; EchoMRI) (D), fasted plasma insulin (µU/ml) (E) and insulin sensitivity (glucose turnover rate in mg/kg min) (F), in Nod1−/− or Nod2−/− mice and their corresponding WT controls after 4 weeks of a NC or a HFD (mean ± SEM; n = 11 (D); 8 (E); or 5 (F); data with identical superscript letters do not differ from each other with p > 0.05).
G. Intraperitoneal glucose tolerance test (IPGTT) (1 g/kg) in WT, ob/ob, ob/obxCD14−/− and CD14−/− mice (all NC-fed) (mean ± SEM; n = 8; *p < 0.05 versus ob/ob).
H. IPGTT corresponding index (µM/min) from 30 min before to 90 min after glucose administration (mean ± SEM; n = 8; data with identical superscript letters do not differ from each other with p > 0.05).
I. Fat mass (% of body weight; EchoMRI) in WT, ob/ob, ob/obxCD14−/− and CD14−/− mice (all NC-fed) (mean ± SEM; n = 8; data with identical superscript letters do not differ from each other with p > 0.05).
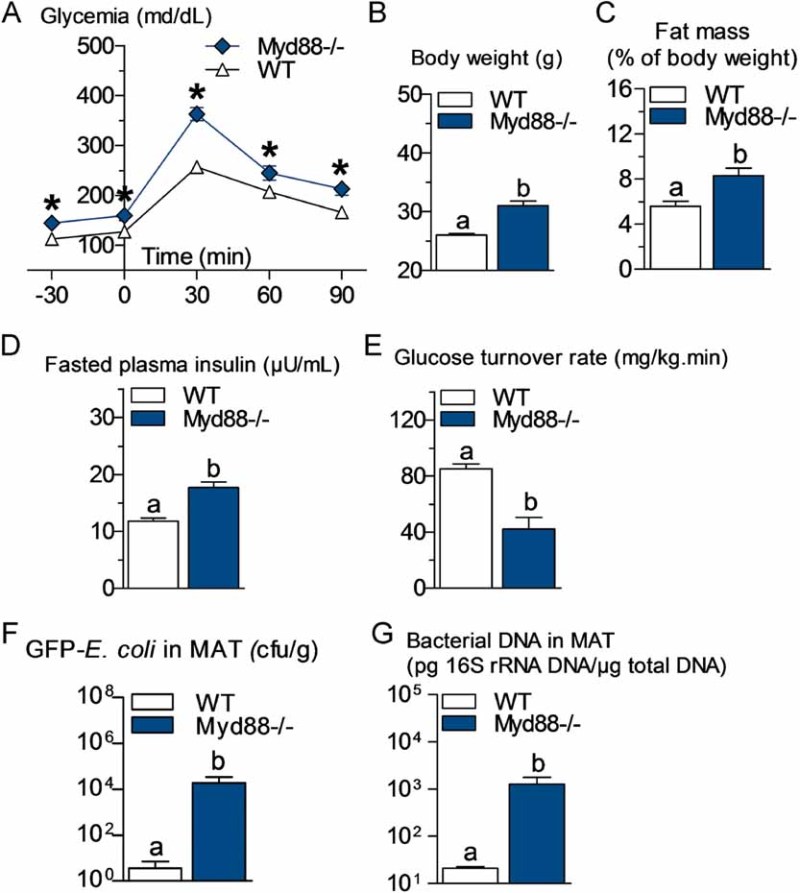
A. Intraperitoneal glucose tolerance test (IPGTT) (1 g/kg) in Myd88-deficient mice (Myd88−/−) and their corresponding wild-type controls (WT) fed a normal chow (NC) diet (mean ± SEM; n = 7; *p < 0.05 versus controls).
B,C,D,E. Body weight (B), fat mass (% of body weight; EchoMRI) (C), fasted plasma insulin (µU/ml) (D) and insulin sensitivity (glucose turnover rate in mg/kg min) (E), in Myd88−/− mice and their corresponding WT controls fed a NC diet (mean ± SEM; n = 5; data with identical superscript letters do not differ from each other with p > 0.05).
F. Number of GFP-E. coli cfu per g of MAT in Myd88−/− mice and their corresponding WT controls fed a NC diet, 2 h post-gavage with 109 cfu of GFP-E. coli (mean ± SEM; n = 7; data with identical superscript letters do not differ from each other with p > 0.05).
G. 16S rRNA DNA concentration (pg/µg total DNA; qPCR) from total bacteria in MAT of Myd88−/− mice and their corresponding WT controls fed a NC diet (mean ± SEM; n = 7; data with identical superscript letters do not differ from each other with p > 0.05).
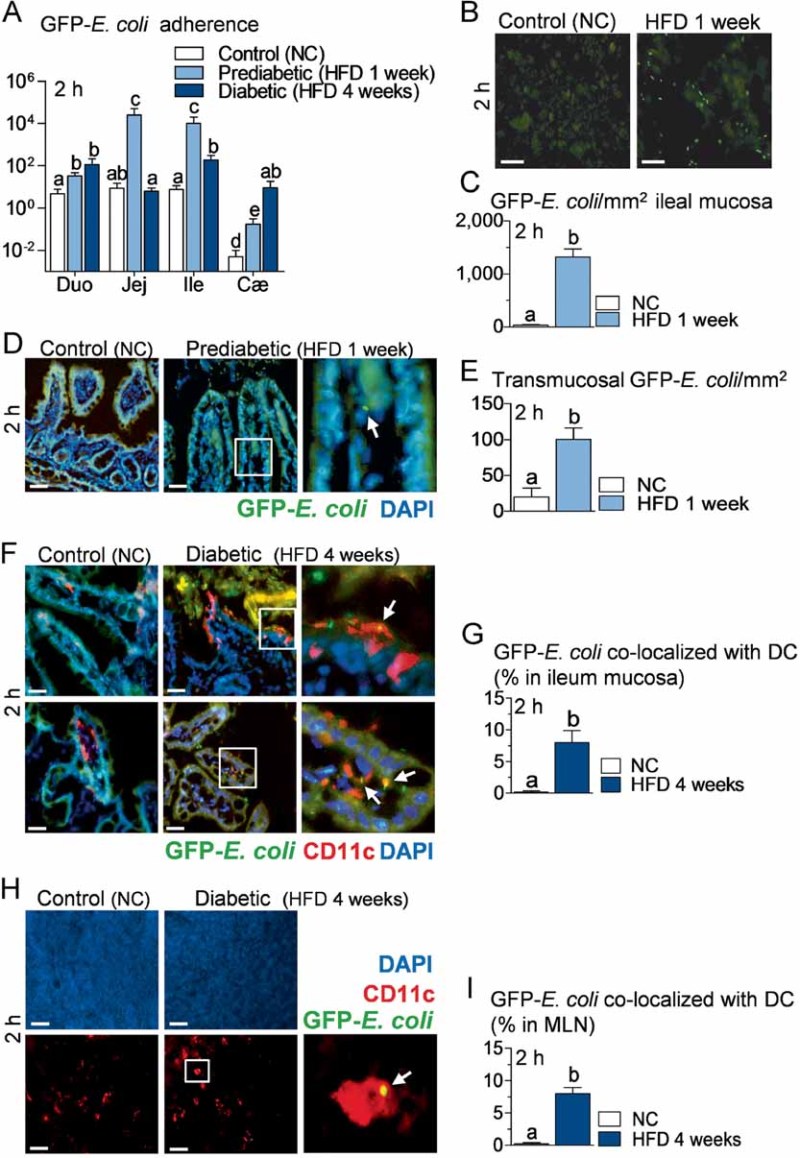
A. Bacterial adherence (GFP-E. coli cfu per cm of mucosa/GFP-E. coli cfu per cm of lumen) in normal chow (NC)-fed (Control NC), prediabetic (HFD 1 week), and diabetic mice (HFD 4 weeks), 2 h after gavage with 109 cfu of GFP-E. coli (Duo, duodenum; Jej, jejunum; Ile, ileum; Cæ, cæcum) (mean ± SEM; n = 10–12; data with identical superscript letters do not differ from each other with p > 0.05).
B. Fluorescence microscopy of scrapped ileal mucosa from NC-fed (Control NC) and prediabetic mice (HFD 1 week), 2 h after gavage with 109 cfu of GFP-E. coli. Bars = 20 µm.
C. Corresponding number of GFP-E. coli/mm2 of scrapped ileal mucosa (fluorescence microscopy) (mean ± SEM; n = 6; data with identical superscript letters do not differ from each other with p > 0.05).
D. Fluorescence microscopy of DAPI-counterstained cryosections of ileum from NC-fed (Control NC) and prediabetic mice (HFD 1 week), 2 h after gavage with 109 cfu of GFP-E. coli. Right panel corresponds to magnification of surrounded region. Bars = 20 µm.
E. Corresponding number of transmucosal GFP-E. coli/mm2 of ileum section (fluorescence microscopy) (mean ± SEM; n = 6; data with identical superscript letters do not differ from each other with p > 0.05).
F,H. Immunofluorescent labelling of CD11c-positive cells [dendritic cells (DC) in red] and co-localization with fluorescent GFP-E. coli (green) on DAPI-counterstained (nuclei in blue) cryosections of ileum (F), and MLN (H), from NC-fed (Control NC), and diabetic mice (HFD 4 weeks), 2 h after gavage with 109 cfu of GFP-E. coli. Arrows point co-localizations (yellow). Right panels correspond to magnification of surrounded regions. Bars = 20 µm.
G,I. Corresponding quantification of CD11c-positive cells co-localized with GFP-E. coli (% of total DC) in ileum (G) and MLN (I) (mean ± SEM; n = 6; data with identical superscript letters do not differ from each other with p > 0.05).
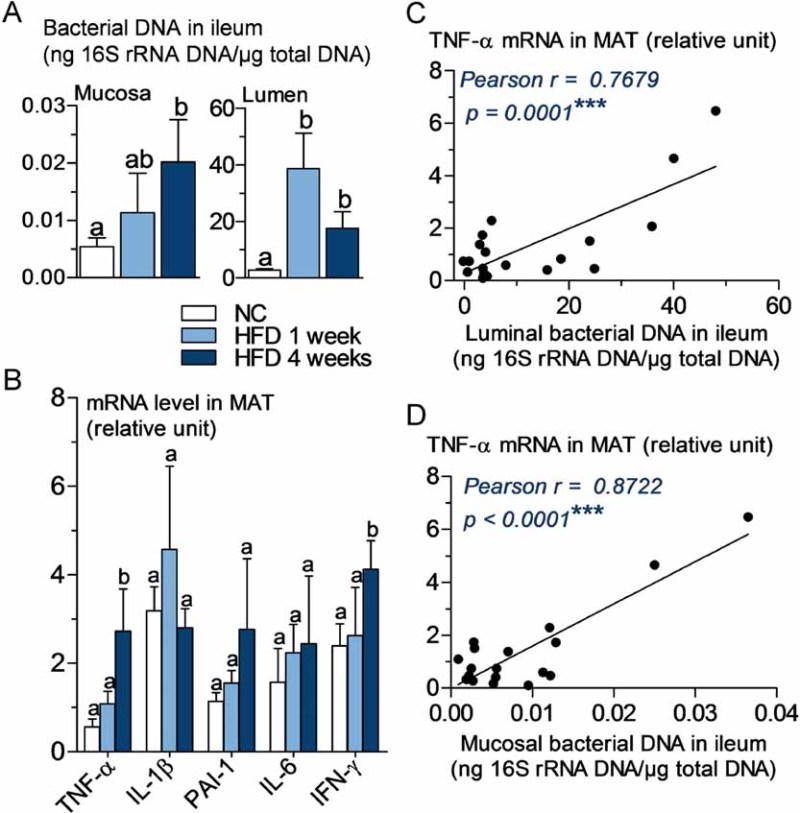
A. 16S rRNA DNA concentration (ng/µg total DNA; qPCR) from total bacteria in mucosa and lumen of ileum, in normal chow (NC)-fed, prediabetic (HFD 1 week), and diabetic mice (HFD 4 weeks) (mean ± SEM; n = 6; data with identical superscript letters do not differ from each other with p >0.05).
B. Concentration of mRNA coding for the inflammatory markers TNF-α, IL-1β, PAI-1, IL-6 and IFN-γ in MAT of normal chow (NC)-fed, prediabetic and diabetic mice (RT-qPCR) (mean ± SEM; n = 6; data with identical superscript letters do not differ with p > 0.05; expressions of the different markers were not compared between themselves).
C,D. Correlations between TNF-α expression in MAT and bacterial concentration (ng 16S rRNA DNA/µg total DNA; qPCR), of ileal lumen (C), and ileal mucosa (D), in NC-fed, prediabetic (HFD 1 week), and diabetic mice (HFD 4 weeks).
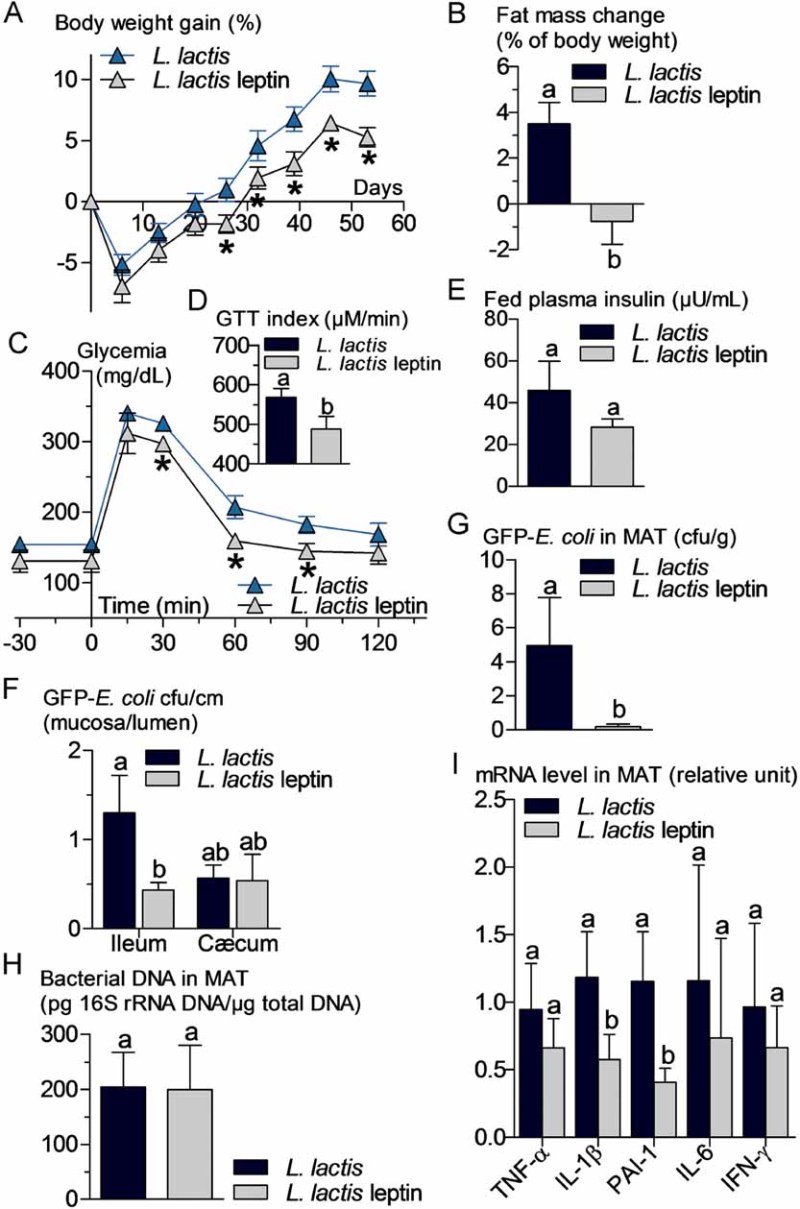
A,B. Body weight gain (% of initial weight) (A), fat mass change during treatment in % of body weight (EchoMRI) (B) (mean ± SEM; n = 6; *p < 0.05 versus controls (A); data with identical superscript letters do not differ from each other with p > 0.05 (B)).
C,D. Oral glucose tolerance test (OGTT) (1.5 g/kg) (C), and corresponding index (µM/min) from 30 min before to 120 min after glucose administration (D) (mean ± SEM; n = 6; *p < 0.05 versus controls (C); data with identical superscript letters do not differ from each other with p > 0.05 (D)).
E,F,G,H. Fed plasma insulin (µU/ml) (E), GFP-E. coli adherence (GFP-E. coli cfu per cm of mucosa/GFP-E. coli cfu per cm of lumen) in ileum and cæcum, 2 h post-gavage with 109 cfu of GFP-E. coli (F), number of GFP-E. coli cfu per g of MAT, 2 h post-gavage with 109 cfu of GFP-E. coli (G), and 16S rRNA DNA concentration (pg/µg total DNA; qPCR) from total bacteria in MAT (H) (mean ± SEM; n = 6; data with identical superscript letters do not differ from each other with p > 0.05).
I. Concentration of mRNA coding for the inflammatory markers TNF-α, IL-1β, PAI-1, IL-6 and IFN-γ in MAT (RT-qPCR) (mean ± SEM; n = 6; data with identical superscript letters do not differ with p > 0.05; expressions of the different markers were not compared between themselves).
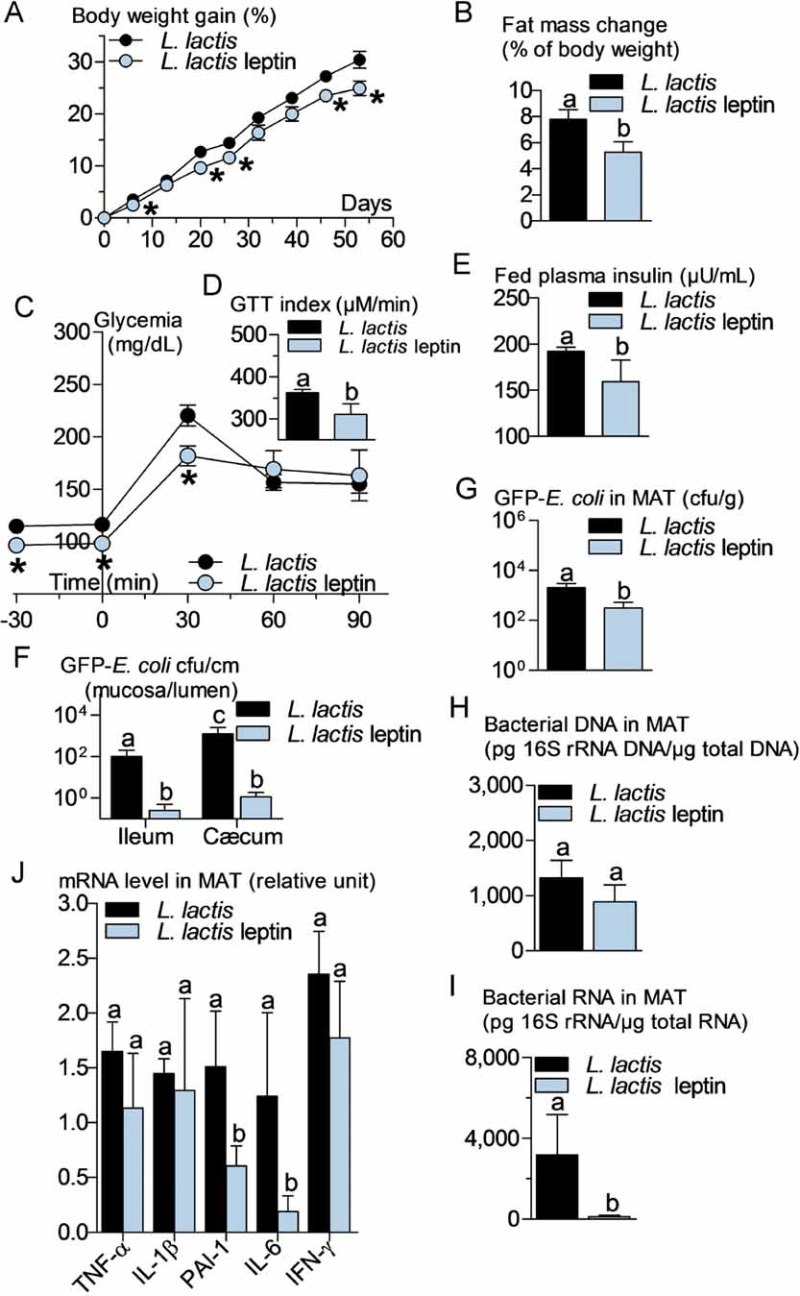
A,B. Body weight gain (% of initial weight) (A), fat mass change during treatment time course (% of body weight; EchoMRI) (B) (mean ± SEM; n = 6; *p < 0.05 versus controls (A); data with identical superscript letters do not differ from each other with p > 0.05 (B)).
C,D. Intraperitoneal glucose tolerance test (IPGTT) (1 g/kg) (C), and corresponding index (µM/min) from 30 min before to 90 min after glucose administration (D) (mean ± SEM; n = 6; *p < 0.05 versus controls (C); data with identical superscript letters do not differ from each other with p > 0.05 (D)).
E,F,G,H,I. Fed plasma insulin (µU/ml) (E), GFP-E. coli adherence (GFP-E. coli cfu per cm of mucosa/GFP-E. coli cfu per cm of lumen) in ileum and cæcum, 2 h post-gavage with 109 cfu of GFP-E. coli (F), number of GFP-E. coli cfu per g of MAT, 2 h post-gavage with 109 cfu of GFP-E. coli (G), 16S rRNA DNA concentration (pg/µg total DNA; qPCR) from total bacteria in MAT (H), 16S rRNA concentration (pg/µg total RNA; RT-qPCR) from total bacteria in MAT (I) (mean ± SEM; n = 6; data with identical superscript letters do not differ from each other with p > 0.05).
J. Concentration of mRNA coding for the inflammatory markers TNF-α, IL-1β, PAI-1, IL-6 and IFN-γ in MAT (RT-qPCR, 2−ΔΔCt) (mean ± SEM; n = 6; data with identical superscript letters do not differ with p > 0.05; expressions of the different markers were not compared between themselves).
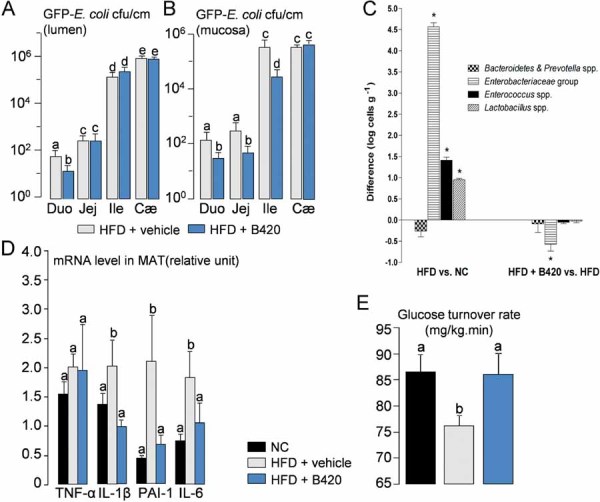
A,B. Luminal (A) and mucosal (B) number of colony forming units (cfu) per cm of duodenum (Duo), jejunum (Jej), ileum (Ile), and cæcum (Cæ), 2 h following oral gavage with 109 cfu of GFP-E. coli.) (mean ± SEM; n = 8; data with identical superscript letters do not differ with p > 0.05).
C. Difference in major groups of bacteria in MAT (qPCR), between HFD and NC groups (left panel), and HFD + B420 and HFD groups (right panel) (mean ± SEM; n = 8; *p < 0.05).
D. Concentration of mRNA coding for the inflammatory markers TNF-α, IL-1β, PAI-1 and IL-6 in MAT (RT-qPCR) (mean ± SEM; n = 8–10; data with identical superscript letters do not differ with p > 0.05; expressions of the different markers were not compared between themselves).
E. Insulin sensitivity (glucose turnover rate in mg/kg min). (mean ± SEM; n = 8–10; data with identical superscript letters do not differ with p > 0.05).
References
-
- Amar J, Burcelin R, Ruidavets J, Cani P, Fauvel J, Alessi M, Chamontin B, Ferrieres J. Energy intake is associated with endotoxemia in apparently healthy men. Am J Clin Nutr. 2008;87:1219–1223. - PubMed
-
- Backhed F, Ley RE, Sonnenburg JL, Peterson DA, Gordon JI. Host-bacterial mutualism in the human intestine. Science. 2005;307:1915–1920. - PubMed
-
- Burcelin R, Crivelli V, Dacosta A, Roy-Tirelli A, Thorens B. Heterogeneous metabolic adaptation of C57BL/6J mice to high-fat diet. Am J Physiol Endocrinol Metab. 2002;282:E834–E842. - PubMed
MeSH terms
Substances
LinkOut - more resources
Full Text Sources
Other Literature Sources
Medical
Research Materials
Miscellaneous
