

Quantitative measurements of inequality in geographic accessibility to pediatric care in Oita Prefecture, Japan: standardization with complete spatial randomness
- PMID: 21736715
- PMCID: PMC3146410
- DOI: 10.1186/1472-6963-11-163
Quantitative measurements of inequality in geographic accessibility to pediatric care in Oita Prefecture, Japan: standardization with complete spatial randomness
Abstract
Background: A quantitative measurement of inequality in geographic accessibility to pediatric care as well as that of mean distance or travel time is very important for priority setting to ensure fair access to pediatric facilities. However, conventional techniques for measuring inequality is inappropriate in geographic settings. Since inequality measures of access distance or travel time is strongly influenced by the background geographic distribution patterns, they cannot be directly used for regional comparisons of geographic accessibility. The objective of this study is to resolve this issue by using a standardization approach.
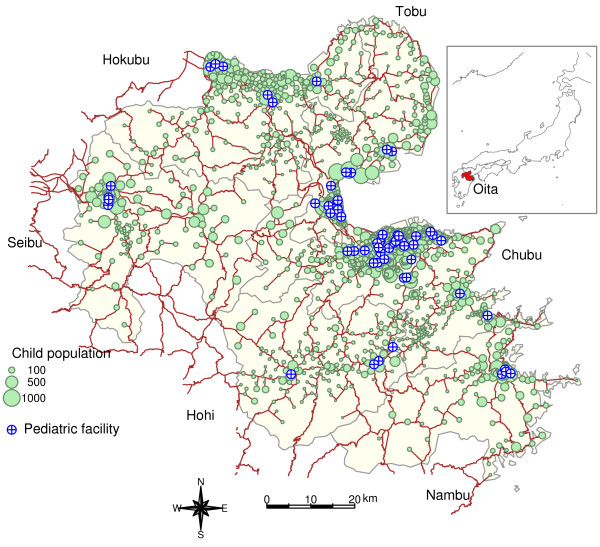
Methods: Travel times to the nearest pediatric care were calculated for all children in Oita Prefecture, Japan. Relative mean differences were considered as the inequality measure for secondary medical service areas, and were standardized with an expected value estimated from a Monte Carlo simulation based on complete spatial randomness.
Results: The observed mean travel times in the area considered averaged 4.50 minutes, ranging from 1.83 to 7.02 minutes. The mean of the observed inequality measure was 1.1, ranging from 0.9 to 1.3. The expected values of the inequality measure varied according to the background geographic distribution pattern of children, which ranged from 0.3 to 0.7. After standardizing the observed inequality measure with the expected one, we found that the ranks of the inequality measure were reversed for the observed areas.
Conclusions: Using the indicator proposed in this paper, it is possible to compare the inequality in geographic accessibility among regions. Such a comparison may facilitate priority setting in health policy and planning.
Figures


Similar articles
-
Spatial accessibility to pediatric services.J Community Health. 2008 Dec;33(6):444-8. doi: 10.1007/s10900-008-9112-x. J Community Health. 2008. PMID: 18581216
-
Non-physician communities in Japan: are they still disadvantaged?Rural Remote Health. 2014;14(3):2907. Epub 2014 Sep 24. Rural Remote Health. 2014. PMID: 25270075
-
Spatiotemporal trends and geographic disparities in spatial accessibility to maternal and child health services in Nanning, China: impact of two-child policies.BMC Health Serv Res. 2024 Aug 15;24(1):934. doi: 10.1186/s12913-024-11415-z. BMC Health Serv Res. 2024. PMID: 39148114 Free PMC article.
-
Children's access to major hospitals estimated to provide pediatric inpatient services 24 h a day in Japan.Eur J Pediatr. 2018 Apr;177(4):559-565. doi: 10.1007/s00431-018-3106-1. Epub 2018 Jan 29. Eur J Pediatr. 2018. PMID: 29380054
-
The application of spatial measures to analyse health service accessibility in Australia: a systematic review and recommendations for future practice.BMC Health Serv Res. 2023 Apr 1;23(1):330. doi: 10.1186/s12913-023-09342-6. BMC Health Serv Res. 2023. PMID: 37005659 Free PMC article.
Cited by
-
Reoccurring neural stem cell divisions in the adult zebrafish telencephalon are sufficient for the emergence of aggregated spatiotemporal patterns.PLoS Biol. 2020 Dec 8;18(12):e3000708. doi: 10.1371/journal.pbio.3000708. eCollection 2020 Dec. PLoS Biol. 2020. PMID: 33290409 Free PMC article.
-
Location of Road Emergency Stations in Fars Province, Using Spatial Multi-Criteria Decision Making.Bull Emerg Trauma. 2015 Jan;3(1):8-15. Bull Emerg Trauma. 2015. PMID: 27162894 Free PMC article.
-
Socioeconomic, urban-rural and sex-based inequality in infant mortality rate: evidence from 2013 Yemen demographic and health survey.Arch Public Health. 2021 Apr 29;79(1):64. doi: 10.1186/s13690-021-00589-1. Arch Public Health. 2021. PMID: 33926550 Free PMC article.
References
-
- Mastuo N, Takayama JI, Takemura K, Kamoshita S. Japanese National Strategic Plan for Medial Care and Maternal and Child Health Care. Japan Medical Association Journal. 2005;48:283–290.
-
- Hakui T. Problems in Medical Care Services for Children. Japan Medical Association Journal. 2005;48:271–475.
-
- Kamoshita S. Ishi-kajo-jidai no shonikai-sankai-busoku. The Journal of the Japan Medical Association. 2003;130:275.
Publication types
MeSH terms
LinkOut - more resources
Full Text Sources
Medical
