. 2011 Jul 7;13(4):R110.
doi: 10.1186/ar3394.

Evaluation of long-term antinociceptive properties of stabilized hyaluronic acid preparation (NASHA) in an animal model of repetitive joint pain

Affiliations

Evaluation of long-term antinociceptive properties of stabilized hyaluronic acid preparation (NASHA) in an animal model of repetitive joint pain

Michael Karl Boettger et al. Arthritis Res Ther. .

Abstract

Introduction: Clinical trials provided controversial results on whether the injection of hyaluronan preparations into osteoarthritic joints reduces pain. Problems of clinical studies may be the substantial placebo effects of intra-articular injections, different severity and rate of progression of the disease and others. We hypothesize that the use of preclinical pain models may help to clarify whether a certain hyaluronan exerts antinociceptive effects upon intra-articular injection. In the present study we tested in the bradykinin/prostaglandin E(2) (PGE(2)) model primarily the putative antinociceptive effect of stabilized hyaluronic acid from a non animal source (NASHA), a stabilized hyaluronic acid based gel for intra-articular treatment of OA. We established a dose-response relationship for NASHA and we compared NASHA to other hyaluronans with different formulations that are in clinical use.

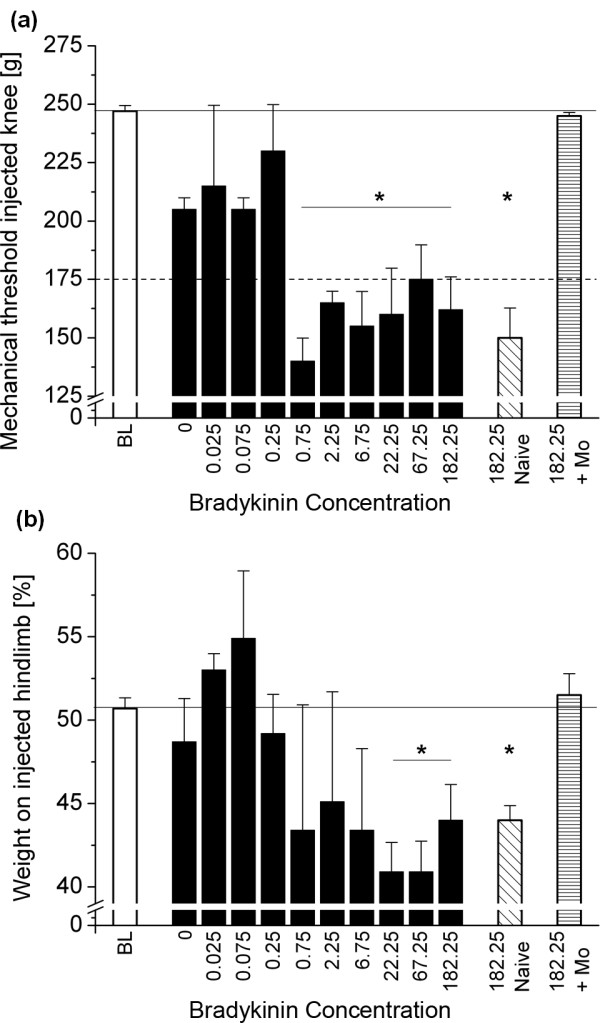
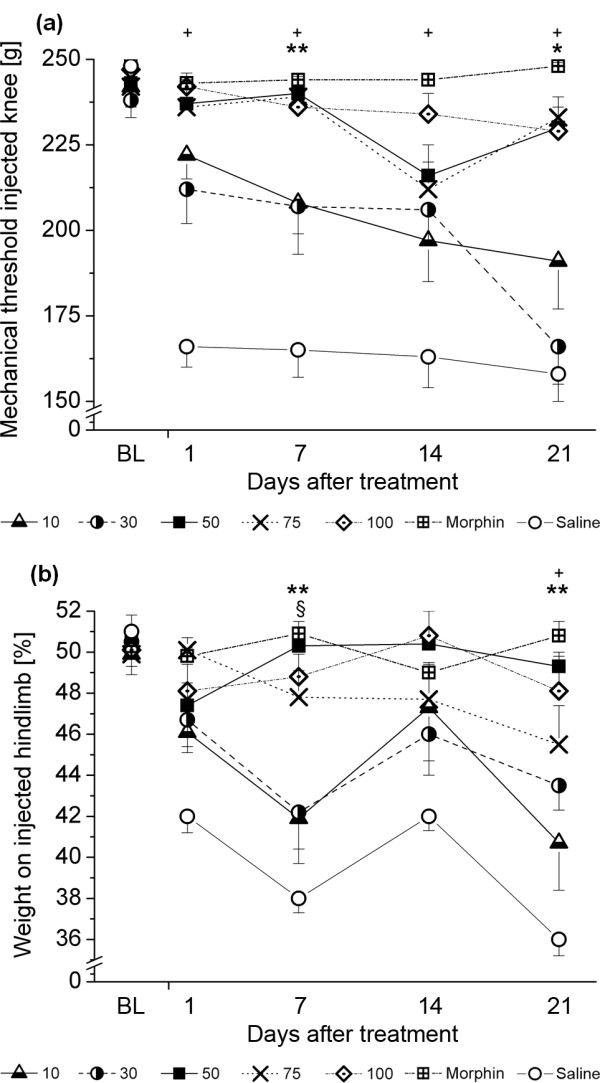
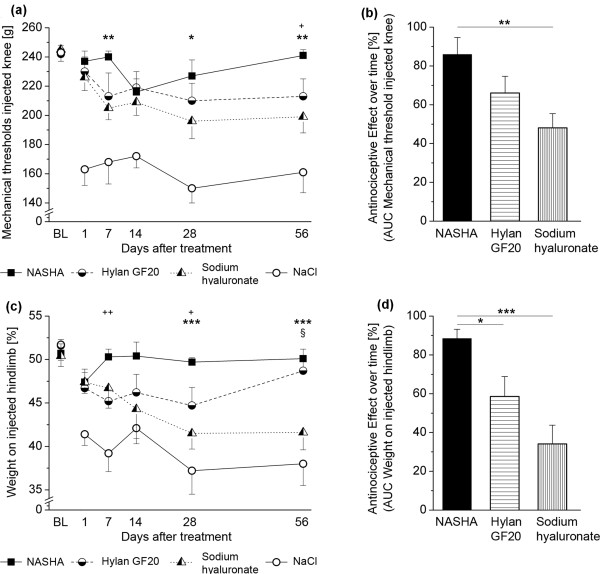
Methods: To induce transient joint pain episodes bradykinin and PGE(2) were repetitively administered intra-articularly and unilaterally into rat knee joints during short anaesthesia. After establishment of the predrug nociceptive responses, a single intra-articular injection of saline or NASHA at different concentrations was administered and pain responses to further bradykinin/PGE(2) injections were monitored up to 56 days after NASHA. Furthermore, the obtained effective dose was compared to clinically defined concentrations of Hylan GF20 and sodium hyaluronate. The primary outcome measures were primary mechanical hyperalgesia at the knee joint and pain-induced weight bearing.

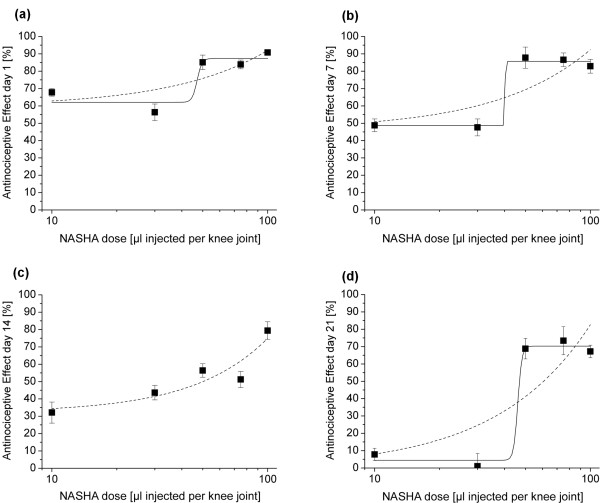
Results: On day 1 after injection, all tested hyaluronan preparations showed an antinociceptive effect >50% compared to saline. Single injections of higher doses of NASHA (50, 75 and 100 μl) were antinociceptive up to 56 days. When injection volumes in rat knee joints were adapted to clinical injection volumes in humans, the antinociceptive effects of the cross-linked NASHA and Hylan GF20 had a longer duration than that of the non cross-linked sodium hyaluronate (with a slightly better effect of NASHA than Hylan GF20).

Conclusions: In the bradykinin/PGE(2) model of joint pain a single injection of all hyaluronan preparations provided significant antinociceptive effects compared to saline. It appeared that the duration of the antinociceptive effect of the cross-linked hyaluronan preparations NASHA and Hylan GF20 was more prolonged. In addition, the gel beads structure allowing only a slow release of hyaluronic acid (NASHA) may even enhance this prolonged antinociceptive effect.


Figures

Figure 1
Figure 1
Induction of transient pain by co-injection of PGE2 (0.5 μg) and bradykinin at different concentrations. (a) Primary mechanical hyperalgesia as assessed by ascending pressure applied to the knee joint. Here, the desired drop in mechanical thresholds from baseline (BL) of more than 30% was obvious starting from 0.75 μg bradykinin in an escalating dose design (n = 4). For the chosen dose of 182.25 μg, this was verified in bradykinin-naïve animals (n = 4). Furthermore, the pain-related behavior induced by this concentration could be reversed by morphine (Mo; n = 4). (b) Weight force on the injected hindpaw (as percentage of total weight on both hindpaws). Here, a significant effect was obvious for concentrations of 22.25 μg and higher. Again, this effect could be verified in bradykinin-naïve animals and morphine administration prevented weight shifting. Data are presented as mean ± standard error of the mean. * P < 0.05 as obtained using t-tests applying Bonferroni-Holm correction. PGE2, prostaglandin E2.
Figure 2
Figure 2
Time course of the antinociceptive effects upon a single intra-articular injection of different NASHA doses. (a) Primary mechanical hyperalgesia at the knee joint as assessed by measuring the mechanical threshold upon ascending pressure applied to the knee joint. NASHA doses were 10, 30, 50, 75, and 100 μl (each n = 11, except 30 μl, n = 10). Here, the lower doses used, 10 and 30 μl injection volumes, showed a linear decrease, while the higher doses did not significantly differ from baseline (BL) levels. (b) Weight force on the injected hindpaw (as percentage of total weight on both hindpaws). Same doses as in a. The effects were similar, yet less clear-cut than those obtained from mechanical thresholds, but verified a shorter-lasting and smaller efficacy of the lower doses. Data are presented as mean ± standard error of the mean. + comparison between NASHA 10 and NASHA 100; * comparison between NASHA 10 and NASHA 50; § comparison between NASHA 50 and NASHA 100. One symbol: P < 0.05; two symbols: P < 0.01 as obtained from descriptive t-tests following repeated measures analysis of variances.
Figure 3
Figure 3
Dose-response relation for NASHA regarding antinociceptive effects on different days. (a to d) Increase in thresholds in relation to saline (0%) and morphine (100%) on days 1, 7, 14, and 21 after injection. Overall, only the higher doses (50, 75, and 100 μl, each n = 11) show an antinociceptive effect of more than 50% beyond day 1, but not 10 and 30 μl (n = 11 and n = 10, respectively). Fitting of linear and sigmoid curves (only linear fitting was possible for day 14) revealed no clear-cut relation, but apparently a certain threshold dose is needed to obtain antinociceptive effects. Data are presented as mean ± standard error of the mean.
Figure 4
Figure 4
Antinociceptive effects of NASHA, Hylan GF20 and sodium hyaluronate during an observation period of 56 days. (a) Primary mechanical hyperalgesia as assessed by ascending pressure applied to the knee joint, after injection of NASHA (50 μl, n = 11), Hylan GF20 (100 μl, n = 9), and sodium hyaluronate (33 μl, n = 11). Although saline-treated animals showed a dramatic drop in mechanical thresholds from day 1, all hyaluronic acid compounds showed antinociceptive properties. These were most pronounced for NASHA and Hylan GF20, which were superior to sodium hyaluronate, particularly in the later stages. (b) When calculating the area under the curve (AUC) in order to quantify the antinociceptive effects of these substances (baseline curve - saline curve), NASHA showed a significantly stronger effect than sodium hyaluronate, whereas only a trend was observed in comparison with Hylan GF20. (c) Weight force on the injected hindpaw (as percentage of total weight on both hindpaws). Same dosing as in a. Here, a similar pattern was obvious, with particularly sodium hyaluronate losing efficacy from day 7 after injection, while NASHA, and to a lesser degree Hylan GF20, maintained weight-bearing behavior close to baseline levels. (d) Calculation of the respective antinociceptive effects for this parameter showed significant differences between NASHA and Hylan GF20 as well as between NASHA and sodium hyaluronate. Data are presented as mean ± standard error of the mean. (a and c) + comparison between NASHA and Hylan GF20. * comparison between NASHA and sodium hyaluronate. § comparison between Hylan GF20 and sodium hyaluronate. One symbol: P < 0.05; two symbols: P < 0.01 as obtained from descriptive t-tests following repeated measures analysis of variances (ANOVAs). (b and d) * P < 0.05; ** P < 0.01 as obtained from descriptive t-tests following one-way ANOVAs.

Similar articles

Cited by

References

    1. Breivik H, Collett B, Ventafridda V, Cohen R, Gallacher D. Survey of chronic pain in Europe: prevalence, impact on daily life, and treatment. Eur J Pain. 2006;10:287–333. doi: 10.1016/j.ejpain.2005.06.009. - DOI - PubMed
    1. Felson DT. An update on the pathogenesis and epidemiology of osteoarthritis. Radiol Clin North Am. 2004;42:1–9. doi: 10.1016/S0033-8389(03)00161-1. - DOI - PubMed
    1. Felson DT, Naimark A, Anderson J, Kazis L, Castelli W, Meenan RF. The prevalence of knee osteoarthritis in the elderly. The Framingham Osteoarthritis Study. Arthritis Rheum. 1987;30:914–918. doi: 10.1002/art.1780300811. - DOI - PubMed
    1. Dardick SJ, Basbaum AI, Levine JD. The contribution of pain to disability in experimentally induced arthritis. Arthritis Rheum. 1986;29:1017–1022. doi: 10.1002/art.1780290811. - DOI - PubMed
    1. Steinmeyer J. Drug therapy of arthrosis. Orthopäde. 2001;30:856–865. - PubMed

LinkOut - more resources