

National Diet and Nutrition Survey: UK food consumption and nutrient intakes from the first year of the rolling programme and comparisons with previous surveys
- PMID: 21736781
- PMCID: PMC3328127
- DOI: 10.1017/S0007114511002340
National Diet and Nutrition Survey: UK food consumption and nutrient intakes from the first year of the rolling programme and comparisons with previous surveys
Abstract
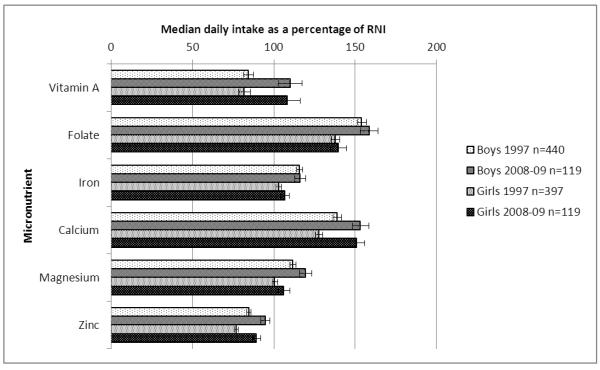
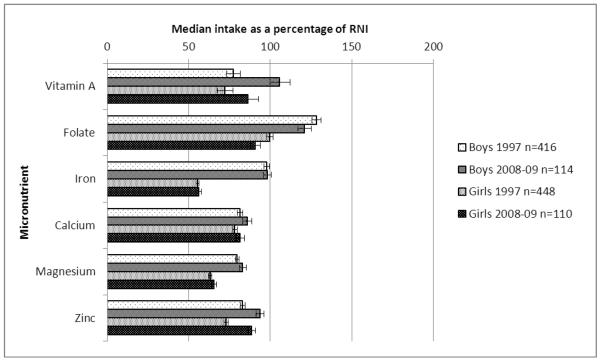
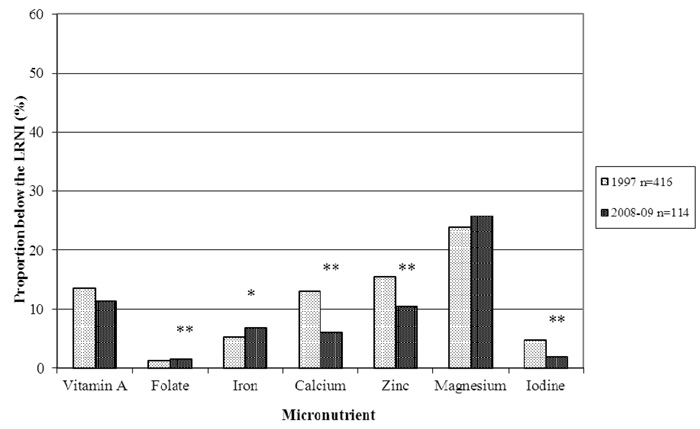
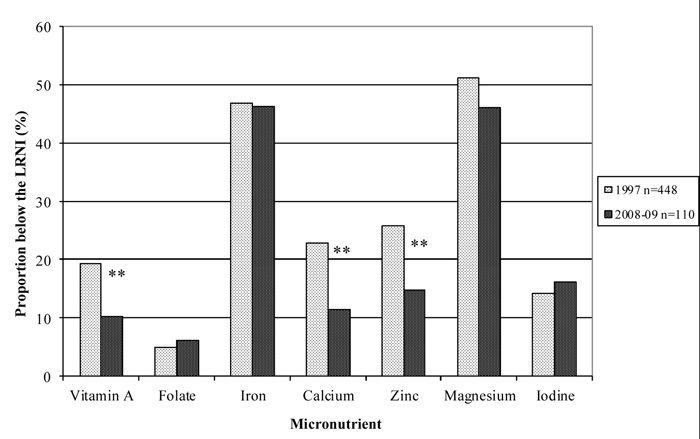
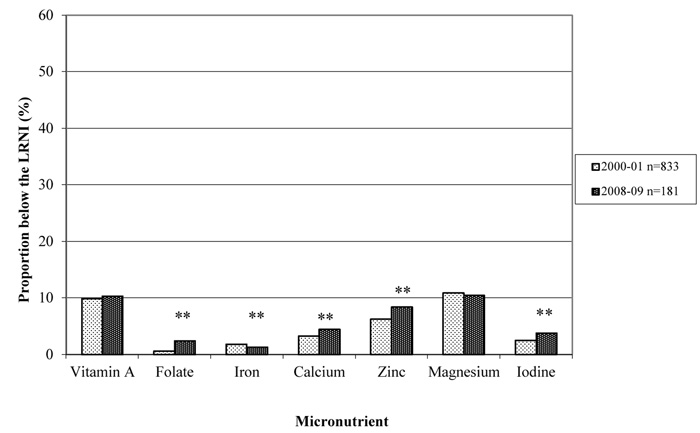
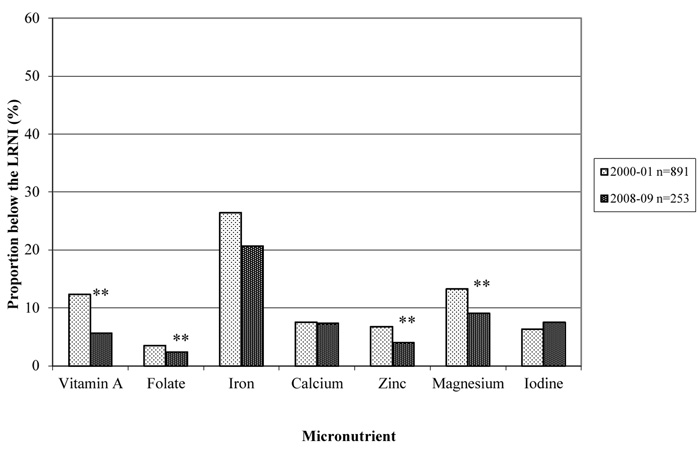
The National Diet and Nutrition Survey (NDNS) is a cross-sectional survey designed to gather data representative of the UK population on food consumption, nutrient intakes and nutritional status. The objectives of the present paper were to identify and describe food consumption and nutrient intakes in the UK from the first year of the NDNS rolling programme (2008-09) and compare these with the 2000-01 NDNS of adults aged 19-64 years and the 1997 NDNS of young people aged 4-18 years. Differences in median daily food consumption and nutrient intakes between the surveys were compared by sex and age group (4-10 years, 11-18 years and 19-64 years). There were no changes in energy, total fat or carbohydrate intakes between the surveys. Children aged 4-10 years had significantly lower consumption of soft drinks (not low calorie), crisps and savoury snacks and chocolate confectionery in 2008-09 than in 1997 (all P < 0·0001). The percentage contribution of non-milk extrinsic sugars to food energy was also significantly lower than in 1997 in children aged 4-10 years (P < 0·0001), contributing 13·7-14·6 % in 2008-09 compared with 16·8 % in 1997. These changes were not as marked in older children and there were no changes in these foods and nutrients in adults. There was still a substantial proportion (46 %) of girls aged 11-18 years and women aged 19-64 years (21 %) with mean daily Fe intakes below the lower reference nutrient intake. Since previous surveys there have been some positive changes in intakes especially in younger children. However, further attention is required in other groups, in particular adolescent girls.
Figures
References
-
- Craig R, Mindell J. Health Survey for England 2006. Volume 1. Cardiovascular disease and risk factors in adults. 2008 http://www.ic.nhs.uk/webfiles/publications/HSE06/HSE%2006%20report%20VOL... (accessed September 2010)
-
- Bromley C, Bradshaw P, Given L. Scottish Health Survey 2008. Volume 1: Main Report. 2009 http://www.scotland.gov.uk/Resource/Doc/286063/0087158.pdf (accessed September 2010)
-
- Haines L, Wan KC, Lynn R, et al. Rising incidence of type 2 diabetes in children in the U.K. Diabetes Care. 2007;30:1097–1101. - PubMed
-
- Khaw K-T, Bingham S, Welch A, et al. Blood pressure and urinary sodium in men and women: the Norfolk Cohort of the European Prospective Investigation into Cancer (EPIC-Norfolk) Am J Clin Nutr. 2004;80:1397–1403. - PubMed
Publication types
MeSH terms
Grants and funding
LinkOut - more resources
Full Text Sources
