. 2011 Oct;39(19):8513-30.
doi: 10.1093/nar/gkr488. Epub 2011 Jul 6.

Enhanced translation by Nucleolin via G-rich elements in coding and non-coding regions of target mRNAs

Affiliations

Enhanced translation by Nucleolin via G-rich elements in coding and non-coding regions of target mRNAs

Kotb Abdelmohsen et al. Nucleic Acids Res. 2011 Oct.

Abstract

RNA-binding proteins (RBPs) regulate gene expression at many post-transcriptional levels, including mRNA stability and translation. The RBP nucleolin, with four RNA-recognition motifs, has been implicated in cell proliferation, carcinogenesis and viral infection. However, the subset of nucleolin target mRNAs and the influence of nucleolin on their expression had not been studied at a transcriptome-wide level. Here, we globally identified nucleolin target transcripts, many of which encoded cell growth- and cancer-related proteins, and used them to find a signature motif on nucleolin target mRNAs. Surprisingly, this motif was very rich in G residues and was not only found in the 3'-untranslated region (UTR), but also in the coding region (CR) and 5'-UTR. Nucleolin enhanced the translation of mRNAs bearing the G-rich motif, since silencing nucleolin did not change target mRNA stability, but decreased the size of polysomes forming on target transcripts and lowered the abundance of the encoded proteins. In summary, nucleolin binds G-rich sequences in the CR and UTRs of target mRNAs, many of which encode cancer proteins, and enhances their translation.


Figures
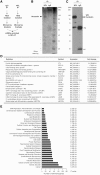
Figure 1.
Figure 1.
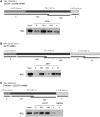
Identification of nucleolin target mRNAs by RNP IP and microarray analysis. (A) IP assay using 3 mg of protein lysate prepared from HeLa cells and 20 μg of either anti-nucleolin antibody or IgG under conditions that preserved mRNP complexes. (B) Visualization of proteins present in the anti-nucleolin or IgG IP reactions, including nucleolin (arrowhead) and several unidentified proteins (asterisks). (C) Nucleolin was detected by western blot analysis in aliquots of IP samples. (D) Partial list of nucleolin target genes identified by microarray analysis. The threshold considered was ≥2-fold. For a complete list, see Supplementary Table S1. (E) Nucleolin target mRNAs were analyzed using Ingenuity Pathway Analysis (IPA). The top target transcripts are involved in cancer, infection, cell growth and proliferation. In (B and D), ‘MW’, molecular weight markers (kDa).
Figure 2.
Figure 2.
Validation of nucleolin targets by RT–qPCR. The abundance of transcripts present in material obtained from HeLa cells after either nucleolin IP or IgG IP was assessed by RT–qPCR analysis. Values show the mean enrichment + standard deviation (SD) from three independent experiments. Measurement of GAPDH mRNA served as loading and background control, since the highly abundant transcript (not a target of nucleolin) is a detectable contaminant present in the IP reactions.
Figure 3.
Figure 3.
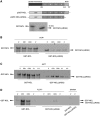
Biotin pull-down assays to assess nucleolin binding to biotinylated transcripts. The indicated biotinylated transcripts (heavy bars) were incubated with cytoplasmic protein lysate from HeLa cells, whereupon their association with nucleolin was detected by western blot analysis. The interaction of nucleolin with biotinylated transcripts spanning different regions of CCNI (A), AKT1 (B) and FLOT1 (C) mRNAs was studied by biotin pull-down analysis (‘Materials and Methods’ section).
Figure 4.
Figure 4.
In vitro interaction of recombinant nucleolin with biotinylated transcripts. (A) Schematic of nucleolin, with its central four RNA-recognition motifs (RRMs, dark gray) and its RGG domain (hatched), and plasmids pGST-NCL and pGST-NCL(ΔRGG) used to purify GST-NCL and GST-NCL(ΔRGG), respectively. (B–D) The biotinylated RNAs used in Figure 3 were incubated with either GST-NCL or GST-NCL(ΔRGG) proteins (‘Materials and Methods’ section); after binding to partial CCNI RNAs (B), AKT1 RNAs (C) and FLOT1 RNAs (D), as well as with the negative control GAPDH RNA, the fusion proteins were detected by western blot analysis using an anti-nucleolin antibody.
Figure 5.
Figure 5.
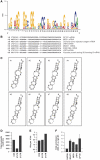
Sequence, structure and genome-wide predictions of nucleolin binding motif. (A) Probability matrix (graphic logo) depicting the relative frequency of finding each residue at each position within the motif, which was elucidated from the microarray data set. (B) Structural alignment of eight examples of the nucleolin motif in specific mRNAs (transcript names are indicated). (C) Secondary structure of the nucleolin motifs shown in (B). (D) Number of nucleolin motif hits identified transcriptome wide. (E) Frequency of nucleolin hits per 10 kb of CR or UTR, transcriptome wide. (F) Validation of nucleolin binding to four predicted target transcripts (MGAT1, MG21, LRP3 and AP1S1 mRNAs) bearing hits of the G-rich nucleolin motif identified in (A).
Figure 6.
Figure 6.
Biotin pull-down assays to assess binding of nucleolin (endogenous or recombinant) to predicted target motifs. (A) The indicated biotinylated transcripts were incubated with cytoplasmic protein lysate from HeLa cells; following pull down, their association with nucleolin was detected by western blot analysis. (B) Recombinant purified proteins [GST-NCL, GST-NCL(ΔRGG) or GST] were incubated with the biotinylated transcripts shown; after pull down, their association was detected by western blot analysis using an antinucleolin antibody (‘Materials and Methods’ section).
Figure 7.
Figure 7.
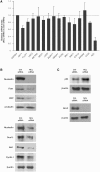
Nucleolin promotes gene expression without influencing target mRNA stability. (A) RT–qPCR analysis of a subset of nucleolin target mRNAs 2 days after transfecting HeLa cells either with control (Ctrl) siRNA or nucleolin (NCL) siRNA. Data shown are the means and SD from three independent experiments; GAPDH mRNA was included for normalization. (B and C) Two days after transfecting HeLa cells as explained in (A), the levels of nucleolin, Flotillin-1, USF2, AKT1, Dus1L and Cyclin I (B), as well as positive controls (encoded by previously reported nucleolin target mRNAs) p53 and Bcl-2 (C) and loading controls α-tubulin and β-actin were assessed by western blot analysis.
Figure 8.
Figure 8.
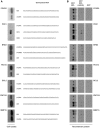
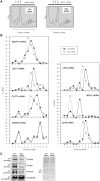
Nucleolin promotes mRNA translation. (A) Forty-eight hours after transfection of HeLa cells with either Ctrl siRNA or NCL siRNA, lysates were prepared and fractionated through sucrose gradients into 12 gradient fractions; 40S and 60S, small and large ribosome subunits, respectively; 80S, monosome; LMWP and HMWP, low- and high-molecular weight polysomes, respectively (‘Materials and Methods’ section). (B) The relative distribution of nucleolin target mRNAs and housekeeping GAPDH mRNA was studied by RT–qPCR analysis of RNA in each of fraction. (C) De novo translation of proteins Usf2, Akt1, and Flot1 and housekeeping protein GAPDH (left) was determined in HeLa cells 48 h after transfection with the small RNAs shown; cells were incubated for 20 min with 35S-labeled amino acids, whereupon the incorporation of the radiolabel into each protein was compared with the unchanged incorporation into GAPDH and with the nonspecific label incorporation detected in the IgG IP samples (right); details in Materials and Methods. Data are representative of three independent experiments.
Figure 9.
Figure 9.
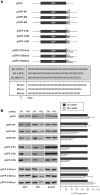
Reporter construct analysis to validate the nucleolin RNA motif. (A) Schematic representation of three nucleolin motif hits (M1, M2, M3) and the G-to-C mutant motifs (M1mut, M2mut and M3mut) cloned in the 3′-UTR or the CR of pGFP reporter constructs. (B) Left, 48 h after cotransfection of these constructs either with Ctrl or NCL siRNAs, cells were lysed and western blot analysis was performed to assess the levels of GFP, nucleolin and loading control β-actin; right, GFP levels were quantified by densitometry and plotted. Transfection with NCL siRNA reduced nucleolin levels to ~21% (pGFP group), 28–46% (pGFP-M1, -M2, -M3 group), 26–34% (pGFP-3′M1, -3′M2, -3′M3 group), 32–39% (pGFP-3′M1mut, -3′M2mut and 3′M3mut group).

References

    1. Moore MJ. From birth to death: the complex lives of eukaryotic mRNAs. Science. 2005;309:1514–1518. - PubMed
    1. Glisovic T, Bachorik JL, Yong J, Dreyfuss G. RNA-binding proteins and post-transcriptional gene regulation. FEBS Lett. 2008;582:1977–1986. - PMC - PubMed
    1. Mitchell P, Tollervey D. mRNA stability in eukaryotes. Curr. Opin. Genet. Dev. 2000;10:193–198. - PubMed
    1. Orphanides G, Reinberg D. A unified theory of gene expression. Cell. 2002;108:439–451. - PubMed
    1. Abdelmohsen K, Kuwano Y, Kim HH, Gorospe M. Posttranscriptional gene regulation by RNA-binding proteins during oxidative stress: implications for cellular senescence. Biol. Chem. 2008;389:243–255. - PMC - PubMed

Publication types