. 2011 Aug 26;286(34):30200-10.
doi: 10.1074/jbc.M111.222968. Epub 2011 Jul 7.

Activation of the bumetanide-sensitive Na+,K+,2Cl- cotransporter (NKCC2) is facilitated by Tamm-Horsfall protein in a chloride-sensitive manner

Affiliations

Activation of the bumetanide-sensitive Na+,K+,2Cl- cotransporter (NKCC2) is facilitated by Tamm-Horsfall protein in a chloride-sensitive manner

Kerim Mutig et al. J Biol Chem. .

Abstract

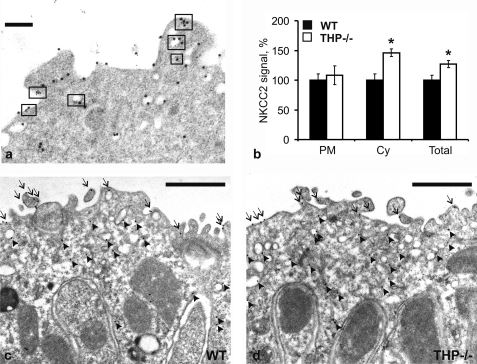
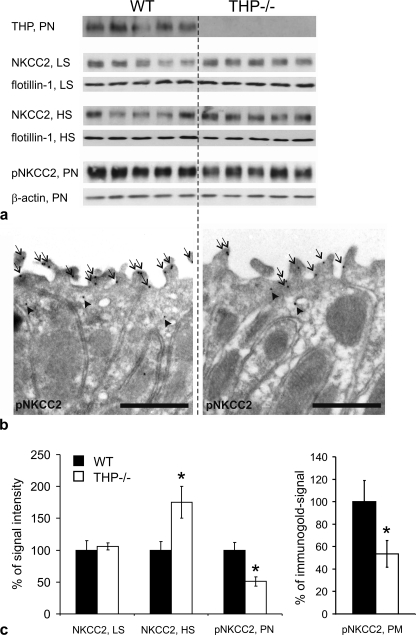
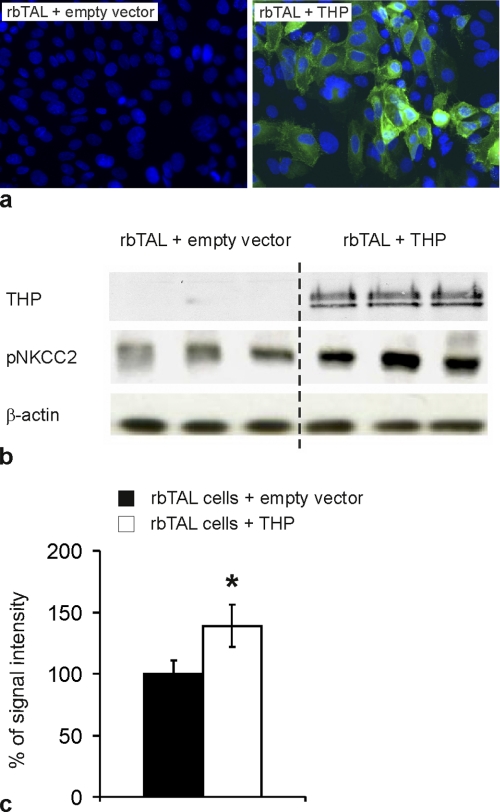
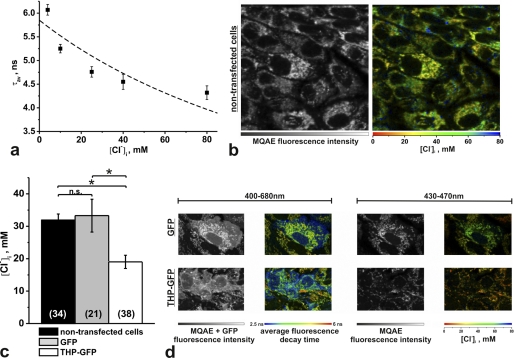
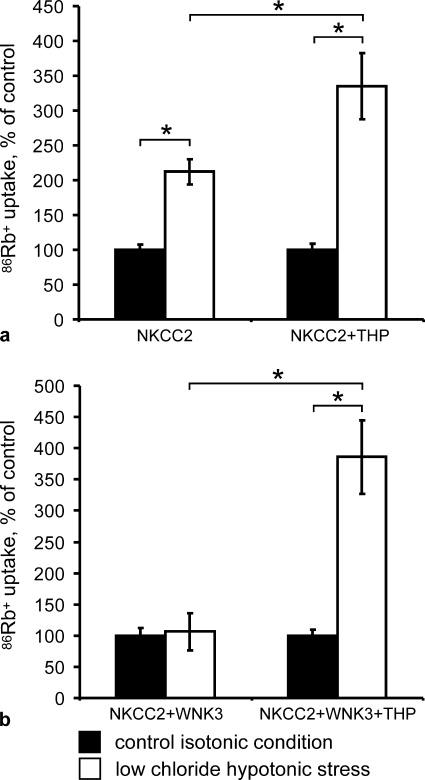
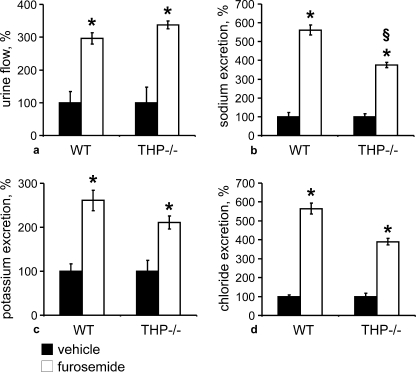
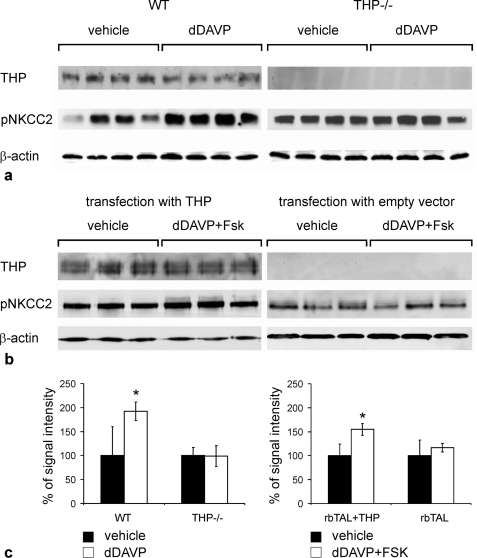
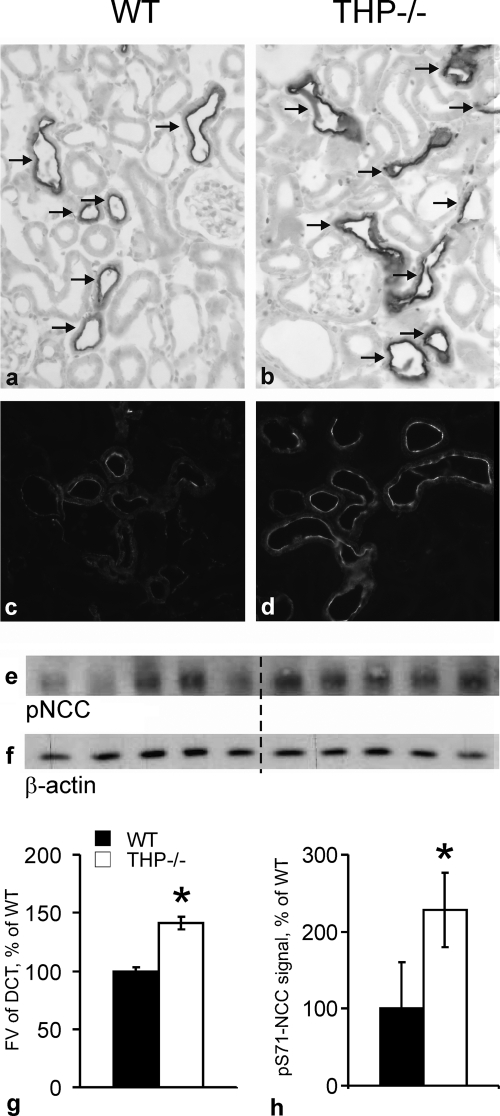
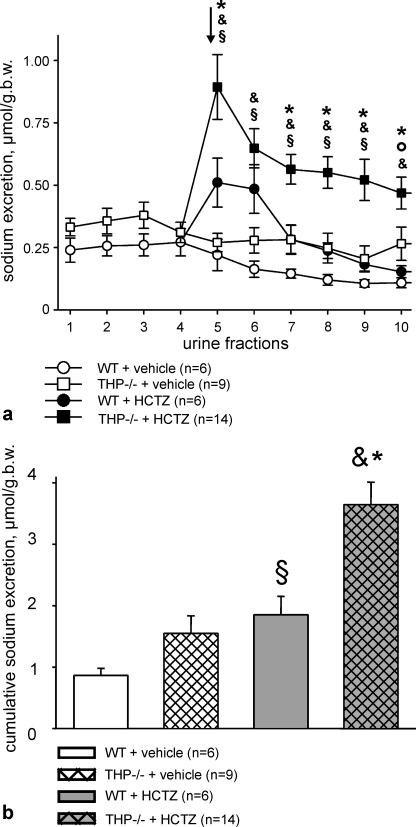
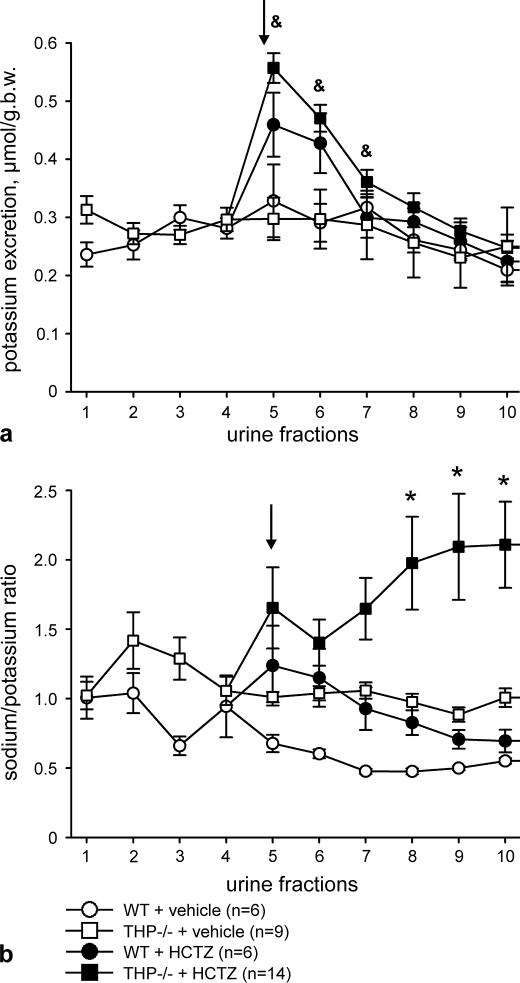
Active transport of NaCl across thick ascending limb (TAL) epithelium is accomplished by Na(+),K(+),2Cl(-) cotransporter (NKCC2). The activity of NKCC2 is determined by vasopressin (AVP) or intracellular chloride concentration and includes its amino-terminal phosphorylation. Co-expressed Tamm-Horsfall protein (THP) has been proposed to interact with NKCC2. We hypothesized that THP modulates NKCC2 activity in TAL. THP-deficient mice (THP(-/-)) showed an increased abundance of intracellular NKCC2 located in subapical vesicles (+47% compared with wild type (WT) mice), whereas base-line phosphorylation of NKCC2 was significantly decreased (-49% compared with WT mice), suggesting reduced activity of the transporter in the absence of THP. Cultured TAL cells with low endogenous THP levels and low base-line phosphorylation of NKCC2 displayed sharp increases in NKCC2 phosphorylation (+38%) along with a significant change of intracellular chloride concentration upon transfection with THP. In NKCC2-expressing frog oocytes, co-injection with THP cRNA significantly enhanced the activation of NKCC2 under low chloride hypotonic stress (+112% versus +235%). Short term (30 min) stimulation of the vasopressin V2 receptor pathway by V2 receptor agonist (deamino-cis-D-Arg vasopressin) resulted in enhanced NKCC2 phosphorylation in WT mice and cultured TAL cells transfected with THP, whereas in the absence of THP, NKCC2 phosphorylation upon deamino-cis-D-Arg vasopressin was blunted in both systems. Attenuated effects of furosemide along with functional and structural adaptation of the distal convoluted tubule in THP(-/-) mice supported the notion that NaCl reabsorption was impaired in TAL lacking THP. In summary, these results are compatible with a permissive role for THP in the modulation of NKCC2-dependent TAL salt reabsorptive function.


Figures

FIGURE 1.
FIGURE 1.
Intracellular distribution of NKCC2 in WT and THP−/− mice (each n = 3) as evaluated with protein A-gold immunostaining of medullary thick ascending limbs. a, double immunostaining for THP (5-nm gold particles) and NKCC2 (10-nm gold particles) demonstrates their co-distribution (rectangular boxes) within the apical membrane and subapical vesicles (scale bar = 0.1 μm). b–d, quantification of the NKCC2 signal (b) by counting the gold particles on representative micrographs from WT (c) and THP−/− mice (d) reveals no differences in luminal plasma membrane (PM, arrows) between strains but significant increases in cytoplasmic vesicles (Cy, arrowheads) in THP−/− compared with WT mice (scale bars = 1 μm). The total NKCC2 signal was accordingly increased in THP−/− mice. At least 10 profiles containing an average of five cells per profile were evaluated per individual. Data are the means ± S.D.; *, p < 0.05 for interstrain differences; WT was set at 100%.
FIGURE 2.
FIGURE 2.
Evaluation of total NKCC2- and phospho (p) NKCC2-immunoreactive signals in kidneys of WT and THP−/− mice (each n = 5). a, shown are immunoblots of plasma membrane-enriched low speed fractions (LS), intracellular vesicle-enriched high speed fractions (HS), or post-nuclear fractions (PN) from kidneys of WT and THP−/− mice recognized by antibodies directed against THP (∼100 kDa), NKCC2 (∼160 kDa), and pNKCC2 (∼160 kDa) paralleled by appropriate loading controls with antibodies against flotillin-1 (∼50 kDa) as a membrane resident protein or β-actin (∼40 kDa). b, shown is immunogold staining of WT and THP−/− ultrathin kidney sections (medullary thick ascending limbs) for pNKCC2 (6-nm gold particles; signal in luminal plasma membrane, arrows; signal in cytoplasmic vesicles, arrowheads; scale bars = 1 μm). c, shown is a densitometric evaluation of immunoreactive signals normalized for the respective loading controls and quantification of pNKCC2 signals in the apical plasma membrane (PM) by counting the gold particles on representative micrographs from WT and THP−/− mice (at least 10 profiles containing an average of 5 cells per profile were evaluated per individual). Data are the means ± S.D.; *, p < 0.05 for interstrain differences; WT is set at 100%.
FIGURE 3.
FIGURE 3.
Evaluation of NKCC2 phosphorylation in cultured rbTAL cells transiently transfected with empty vector or THP. a, transfected cells are stained with anti-THP (green immunofluorescence), and nuclei are counterstained with DAPI (blue); the transient THP-transfection rate was ∼60% (original magnification −400). b, post-nuclear fractions were detected by anti-THP and anti-pNKCC2 and anti-β-actin as the loading control (representative immunoblots are from three independent experiments). c, shown is a densitometric evaluation of pNKCC2 immunoreactive signals normalized for the loading control. Data are the means ± S.D.; *, p < 0.05 for differences between THP-transfected and control cells.
FIGURE 4.
FIGURE 4.
[Cl]i recordings in rbTAL cells using two-photon FLIM and the Cl-sensitive fluorescent dye MQAE. a, in situ calibration using the ionophores tributyltin (40 μm) and nigericin (10 μm) demonstrate the dependence of the MQAE average fluorescence decay time (τav) on [Cl]i. Data were fitted to the Stern-Volmer equation, τav = τav,0/(1 + KSV [Cl]i), where τav,0 and τav are the decay times in the absence and presence of chloride, respectively, and KSV is the Stern-Volmer constant (n = 4–9 measurements, each corresponding to one FLIM image covering 10–20 cells). b, shown are MQAE fluorescence intensity and a corresponding FLIM image of non-transfected cells (τav is converted into [Cl]i and shown in false colors; scale 80 × 80 μm). c, shown is a statistical comparison (analysis of variance) of resting [Cl]i in non-transfected cells and cells transfected with GFP or THP-GFP (n.s., not significant; *, p < 0.01; sample numbers are in parentheses). d, representative images of GFP- and THP-GFP-transfected cells are shown. Images recorded at 400–680 nm unravel both MQAE and GFP fluorescence and display an additional short fluorescence decay time of GFP (blue), which was used to identify and evaluate the transfected cells. Images recorded at 430–470 nm detect only the MQAE fluorescence and allow [Cl]i quantification (scale, 25 × 40 μm). Data are the means ± S.E.
FIGURE 5.
FIGURE 5.
THP facilitates activation of NKCC2 during low chloride hypotonic stress. a and b, Xenopus oocytes were injected with water or the indicated cRNAs, and the bumetanide-sensitive 86Rb+ uptake was measured as described under “Experimental Procedures.” The uptake observed in control isotonic conditions (control) was set at 100%, and data recorded under low chloride hypotonic stress were normalized accordingly. Each panel shows the pooled results from two independent experiments with 10 oocytes per group each. Data are the means ± S.E.; *, p < 0.01 for differences between the indicated groups.
FIGURE 6.
FIGURE 6.
Urinary flow and electrolyte excretion after application of vehicle or furosemide in WT and THP−/− mice (each n = 10). a–d, urinary flow (a), sodium (b), potassium (c), and chloride excretion (d) obtained from WT and THP−/− mice treated with vehicle or furosemide for 4 h. *, p < 0.05 for intrastrain differences between vehicle and furosemide treatments; §, p < 0.05 for interstrain differences in the effects of furosemide. Note the significantly attenuated, furosemide-induced natriuresis in THP−/− compared with WT mice (b). Data are the means ± S.D. normalized to body weight (a) or creatinine excretion (b–d). The vehicle group was set at 100%.
FIGURE 7.
FIGURE 7.
Activation of NKCC2 by short term stimulation of V2 receptor signaling pathway in the presence or absence of THP. a and b, immunoblots of post-nuclear fractions from WT and THP−/− mice (each n = 8; a) or rbTAL-cells transfected with THP or empty vector (b) show THP and pNKCC2 and β-actin as the loading control. c, shown is a densitometric evaluation of pNKCC2 signals normalized to β-actin. Data are the means ± S.D.; *, p < 0.05 for differences between vehicle treatment and stimulation (dDAVP for mice and dDAVP + forskolin (Fsk) for rbTAL-cells).
FIGURE 8.
FIGURE 8.
Evaluation of fractional volumes of DCT and phosphorylation of the NCC in kidneys from WT and THP−/− mice (each n = 4 and n = 5, respectively) at steady state. a and b, representative images show a larger proportion of DCT labeled with antibody against NCC in THP−/− than in WT mice (immunoperoxidase staining); arrows point to DCT. c and d, shown is enhanced phosphorylation of NCC in THP−/− mice compared with WT mice by immunostaining against phospho-NCC. e, shown are post-nuclear fractions from WT and THP−/− mice detected by Western blot and anti-phospho-NCC antibody (∼160 kDa). f, shown are loading controls with antibody against β-actin. g, shown is morphometric quantification of the fractional volume (FV) of DCT. h, shown is a densitometric evaluation of phospho-NCC (Ser(P)-71 (pS71-NCC)) immunoreactive signals normalized for the loading control. Data are the means ± S.D.; *, p < 0.05 for interstrain differences. Original magnification in a–d, ×400.
FIGURE 9.
FIGURE 9.
Urinary sodium excretion under osmotic diuresis alone and after additional application of HCTZ or vehicle in WT and THP−/− mice. a, urinary sodium excretion shows the mean values of urine fractions obtained during osmotic diuresis phase (urine fractions 1–4; WT mice (n = 12), and THP−/− mice (n = 23) and after additional HCTZ or vehicle application (fractions 5–10 after division of the groups; numbers of individuals are indicated in the diagrams). The arrow points to the first urine fraction collected after HCTZ or vehicle treatment. Each fraction was collected within 15 min. b.w., body weight. b, shown is cumulative sodium excretion after HCTZ or vehicle application (sum of fractions 5–10 in a). §, p < 0.05 for differences between HCTZ- and vehicle-treated WT mice; &, p < 0.05 for differences between HCTZ- and vehicle-treated THP−/− mice; °, p < 0.05 for differences between vehicle-treated WT and THP−/− mice; *, p < 0.05 for differences between HCTZ-treated WT and THP−/− mice. All data are given as the means ± S.E.
FIGURE 10.
FIGURE 10.
Urinary potassium excretion and sodium/potassium ratio under osmotic diuresis alone and after additional application of HCTZ or vehicle in WT and THP−/− mice. a, urinary potassium excretion shows the mean values of fractions obtained during the osmotic diuresis phase (urine fractions 1–4; WT mice (n = 12) and THP−/− mice (n = 23)) and after additional HCTZ or vehicle application (fractions 5–10 after division of the groups; numbers of individuals are indicated in the diagrams). The arrow points to the first urine fraction collected after HCTZ or vehicle treatment. Each fraction was collected within 15 min. b, in analogy, sodium/potassium ratios are shown as the means of the respective fractions. &, p < 0.05 for differences between HCTZ- and vehicle-treated THP−/− mice; *, p < 0.05 for differences between HCTZ treated WT and THP−/− mice. For the sodium/potassium ratio, only the differences between HCTZ-treated WT and THP−/− mice are calculated. All data are given as the means ± S.E.

References

    1. Obermüller N., Kunchaparty S., Ellison D. H., Bachmann S. (1996) J. Clin. Invest. 98, 635–640 - PMC - PubMed
    1. Giménez I., Forbush B. (2003) J. Biol. Chem. 278, 26946–26951 - PubMed
    1. Gamba G. (2005) Physiol. Rev. 85, 423–493 - PubMed
    1. Reinalter S. C., Jeck N., Peters M., Seyberth H. W. (2004) Acta Physiol. Scand. 181, 513–521 - PubMed
    1. Rinehart J., Kahle K. T., de Los Heros P., Vazquez N., Meade P., Wilson F. H., Hebert S. C., Gimenez I., Gamba G., Lifton R. P. (2005) Proc. Natl. Acad. Sci. U.S.A. 102, 16777–16782 - PMC - PubMed

Publication types

MeSH terms