Comparative Study
. 2011 Aug 19;109(5):e27-41.
doi: 10.1161/CIRCRESAHA.111.241869. Epub 2011 Jul 7.

Network for activation of human endothelial cells by oxidized phospholipids: a critical role of heme oxygenase 1

Affiliations
Comparative Study

Network for activation of human endothelial cells by oxidized phospholipids: a critical role of heme oxygenase 1

Casey E Romanoski et al. Circ Res. .

Abstract

Rationale: Oxidized palmitoyl arachidonyl phosphatidylcholine (Ox-PAPC) accumulates in atherosclerotic lesions, is proatherogenic, and influences the expression of more than 1000 genes in endothelial cells.

Objective: To elucidate the major pathways involved in Ox-PAPC action, we conducted a systems analysis of endothelial cell gene expression after exposure to Ox-PAPC.

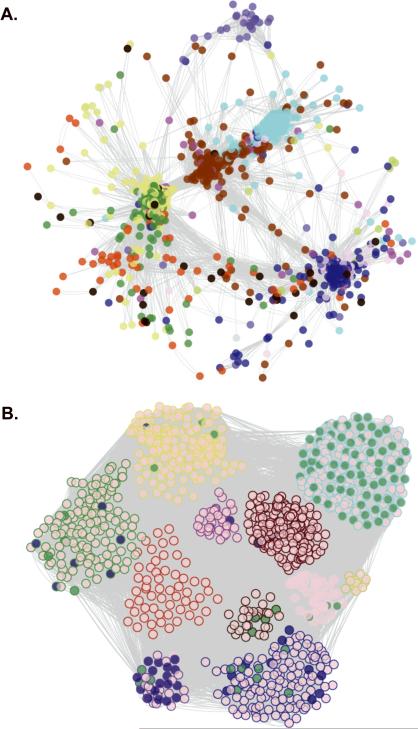
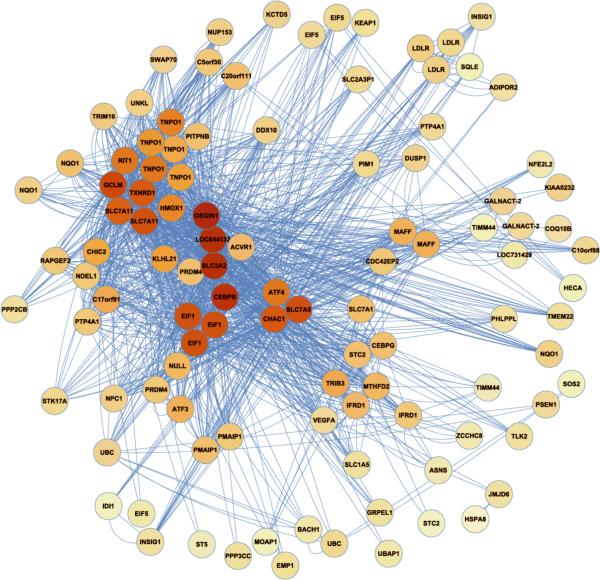
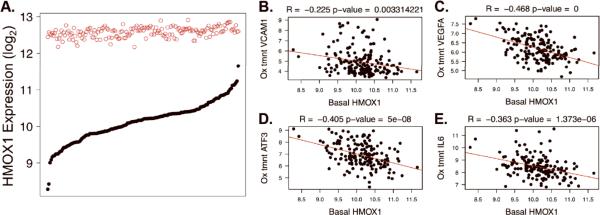
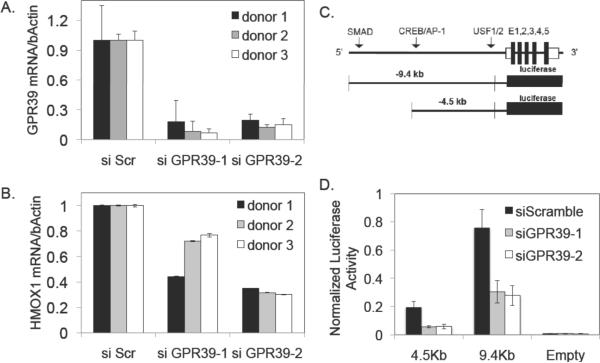
Methods and results: We used the variable responses of primary endothelial cells from 149 individuals exposed to Ox-PAPC to construct a network that consisted of 11 groups of genes, or modules. Modules were enriched for a broad range of Gene Ontology pathways, some of which have not been identified previously as major Ox-PAPC targets. Further validating our method of network construction, modules were consistent with relationships established by cell biology studies of Ox-PAPC effects on endothelial cells. This network provides novel hypotheses about molecular interactions, as well as candidate molecular regulators of inflammation and atherosclerosis. We validated several hypotheses based on network connections and genomic association. Our network analysis predicted that the hub gene CHAC1 (cation transport regulator homolog 1) was regulated by the ATF4 (activating transcription factor 4) arm of the unfolded protein response pathway, and here we showed that ATF4 directly activates an element in the CHAC1 promoter. We showed that variation in basal levels of heme oxygenase 1 (HMOX1) contribute to the response to Ox-PAPC, consistent with its position as a hub in our network. We also identified G-protein-coupled receptor 39 (GPR39) as a regulator of HMOX1 levels and showed that it modulates the promoter activity of HMOX1. We further showed that OKL38/OSGN1 (oxidative stress-induced growth inhibitor), the hub gene in the blue module, is a key regulator of both inflammatory and antiinflammatory molecules.

Conclusions: Our systems genetics approach has provided a broad view of the pathways involved in the response of endothelial cells to Ox-PAPC and also identified novel regulatory mechanisms.


Figures

Figure 1
Figure 1. Visualization and Functional Enrichment of the HAEC Gene Co-Expression Network
In the whole network, 2000 transcripts were organized into 11 modules. The number of module transcripts were: black (93), blue (299), brown (292), green (205), greenyellow (40), magenta (78), pink (82), purple (52), red (158), turquoise (373), yellow (270). The grey module had 58 genes but was not considered a real module. For ease of visualization, the 1090 most connected network transcripts (topological overlap scores > 0.9035) are shown. Circles (nodes) represent genes and lines (edges) represent topological overlap (similar to correlation) between transcript pairs. A. Genes are arranged by topological overlap, so that small distances indicate high correlation and node colors indicate module membership. B. Module membership is indicated by the node outline color and functional enrichment is illustrated by the node fill color. Transcripts belonging to the cell cycle pathway are shaded in green, while ER stress genes (translational initiation, response to unfolded protein, response to ER stress, and protein folding) are shaded in blue. Nodes were arranged manually in B according to module membership.
Figure 2
Figure 2. The Blue Module
Transcripts (nodes) are shaded by the degree of intra-modular connectivity, where red is the most connected (i.e. `hubs'). Lines connecting the transcripts (`edges') signify co-expression. This is a simplified view of the blue module. Refer to Online Figure II for a more thorough representation.
Figure 3
Figure 3. ATF4 directs CHAC1 promoter activity
A. Luciferase expression from sequential CHAC1 promoter-reporter constructs is shown, as normalized to CMV-renilla, and co-transfected with plasmids expressing βGal, ATF4, ATF3 or sXBP1. B. Shown are luciferase expression results from CHAC1 promoter-reporter constructs containing a major CREB/ATF site and sequential internal deletions that were co -transfected with bGal, ATF4, ATF3 and sXBP1 expression plasmids.
Figure 4
Figure 4. HMOX1 Variation and Correlation with Pro-Inflammatory Gene Expression
A. Gene expression intensity (y-axis, log2 scale) is shown for the HMOX1 transcript at baseline (solid black circles) and after treatment with Ox-PAPC (open red circles) in the HAEC population. 149 donors are ranked along the x-axis according to baseline expression. B–E. Basal HMOX1 levels are plotted on the x-axes against the Ox-PAPC treated levels of VCAM1 (B), VEGFA (C), ATF3 (D), and IL6 (E) on the y-axes. R and p-values result from Pearson Correlation. The data shown in 4A is an expansion of data from 96 donors published previously in the same manner (ref 12).
Figure 5
Figure 5. Regulation by HMOX1 in the Network
A. Node border color signifies module membership and the fill indicates whether the Ox-PAPC treated expression level of a gene was correlated with HMOX1 basal levels (red is negative and green is positive correlation). siRNA-mediated knock-down of HMOX1 is shown for two siRNAs with the scrambled control in B. The fold changes of IL1b, IL6, MCP1, LDLR and INSIG1 were normalized to the fold changes measured in the scrambled control in C. mRNA was measured by RT-qPCR and averages ± s.d are shown. Asterisks indicate p-values less than 0.05.
Figure 6
Figure 6. GPR39 Regulates Basal and Ox-PAPC treated Levels of HMOX1
Two siRNAs were used against GPR39 and compared to the scrambled control in A. The baseline values of HMOX1 expression after GPR39 knock-down are shown in B. Results from luciferase HMOX1 promoter constructs (C) are shown in D for control (scrambled) and two GPR39 siRNA knock-downs. Luciferase activity was normalized to CMV-renilla. Plotted are averages ± s.d.

References

    1. Lusis AJ. Atherosclerosis. Nature. 2000;407:233–241. - PMC - PubMed
    1. Levitan I, Volkov S, Subbaiah PV. Oxidized ldl: Diversity, patterns of recognition, and pathophysiology. Antioxid Redox Signal. 2010 - PMC - PubMed
    1. Berliner JA, Leitinger N, Tsimikas S. The role of oxidized phospholipids in atherosclerosis. J Lipid Res. 2009;50(Suppl):S207–212. - PMC - PubMed
    1. Witztum JL, Steinberg D. The oxidative modification hypothesis of atherosclerosis: Does it hold for humans? Trends Cardiovasc Med. 2001;11:93–102. - PubMed
    1. Berliner JA, Watson AD. A role for oxidized phospholipids in atherosclerosis. The New England journal of medicine. 2005;353:9–11. - PubMed

Publication types

MeSH terms

Substances