

Effects of different acute hypoxic regimens on tissue oxygen profiles and metabolic outcomes
- PMID: 21737828
- PMCID: PMC3174795
- DOI: 10.1152/japplphysiol.00492.2011
Effects of different acute hypoxic regimens on tissue oxygen profiles and metabolic outcomes
Abstract
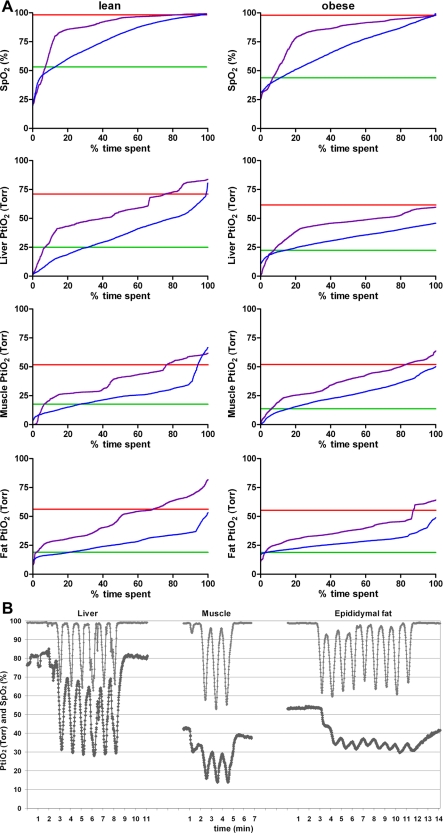
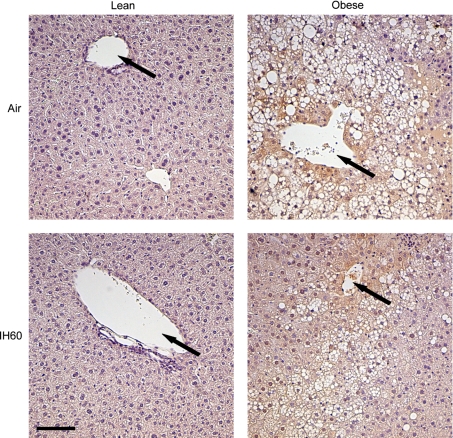
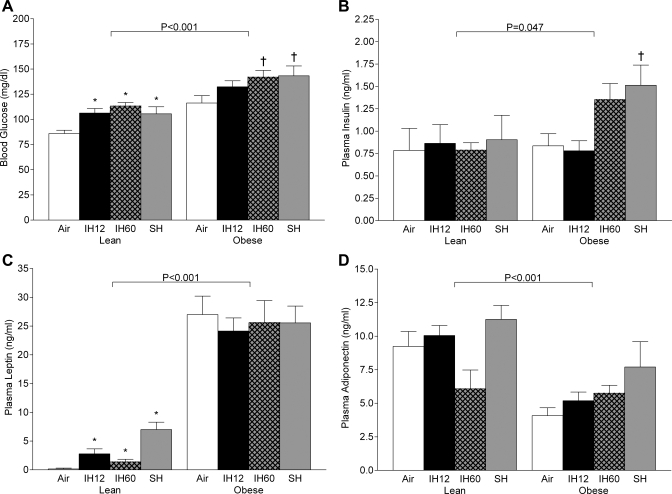
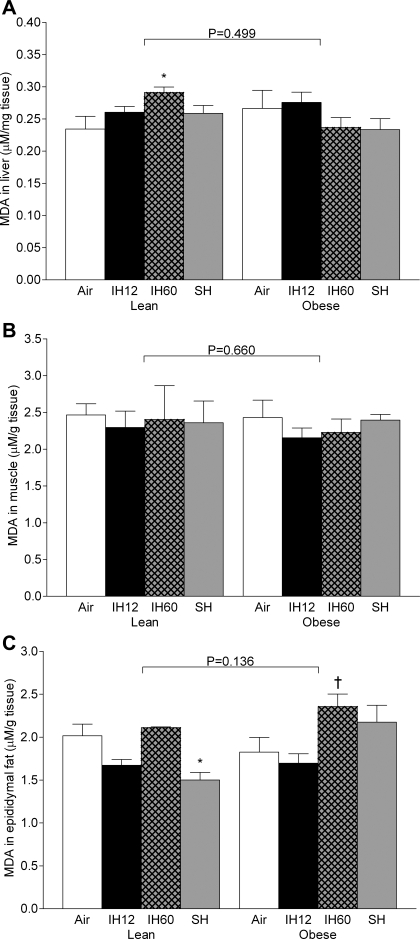
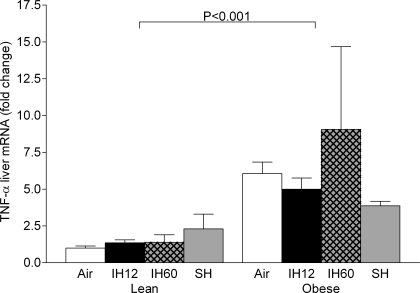
Obstructive sleep apnea (OSA) causes intermittent hypoxia (IH) during sleep. Both obesity and OSA are associated with insulin resistance and systemic inflammation, which may be attributable to tissue hypoxia. We hypothesized that a pattern of hypoxic exposure determines both oxygen profiles in peripheral tissues and systemic metabolic outcomes, and that obesity has a modifying effect. Lean and obese C57BL6 mice were exposed to 12 h of intermittent hypoxia 60 times/h (IH60) [inspired O₂ fraction (Fi(O₂)) 21-5%, 60/h], IH 12 times/h (Fi(O₂) 5% for 15 s, 12/h), sustained hypoxia (SH; Fi(O₂) 10%), or normoxia while fasting. Tissue oxygen partial pressure (Pti(O₂)) in liver, skeletal muscle and epididymal fat, plasma leptin, adiponectin, insulin, blood glucose, and adipose tumor necrosis factor-α (TNF-α) were measured. In lean mice, IH60 caused oxygen swings in the liver, whereas fluctuations of Pti(O₂) were attenuated in muscle and abolished in fat. In obese mice, baseline liver Pti(O₂) was lower than in lean mice, whereas muscle and fat Pti(O₂) did not differ. During IH, Pti(O₂) was similar in obese and lean mice. All hypoxic regimens caused insulin resistance. In lean mice, hypoxia significantly increased leptin, especially during SH (44-fold); IH60, but not SH, induced a 2.5- to 3-fold increase in TNF-α secretion by fat. Obesity was associated with striking increases in leptin and TNF-α, which overwhelmed effects of hypoxia. In conclusion, IH60 led to oxygen fluctuations in liver and muscle and steady hypoxia in fat. IH and SH induced insulin resistance, but inflammation was increased only by IH60 in lean mice. Obesity caused severe inflammation, which was not augmented by acute hypoxic regimens.
Figures

References
-
- Adachi H, Strauss W, Ochi H, Wagner HN., Jr The effect of hypoxia on the regional distribution of cardiac output in the dog. Circ Res 39: 314–319, 1976 - PubMed
-
- Almendros I, Farre R, Planas AM, Torres M, Bonsignore MR, Navajas D, Montserrat JM. Tissue oxygenation in brain, muscle and fat in a rat model of sleep apnea: differential effect of obstructive apneas and intermittent hypoxia (http://www.journalsleep.org/AcceptedPapers/SP-421-10.pdf) Sleep. In press - PMC - PubMed
-
- Bouloumie A, Drexler HC, Lafontan M, Busse R. Leptin, the product of Ob gene, promotes angiogenesis. Circ Res 83: 1059–1066, 1998 - PubMed
Publication types
MeSH terms
Substances
Grants and funding
LinkOut - more resources
Full Text Sources
Medical