. 2011 Aug;121(8):3206-19.
doi: 10.1172/JCI45273.

Human ovarian carcinoma–associated mesenchymal stem cells regulate cancer stem cells and tumorigenesis via altered BMP production

Affiliations

Human ovarian carcinoma–associated mesenchymal stem cells regulate cancer stem cells and tumorigenesis via altered BMP production

Karen McLean et al. J Clin Invest. 2011 Aug.

Abstract

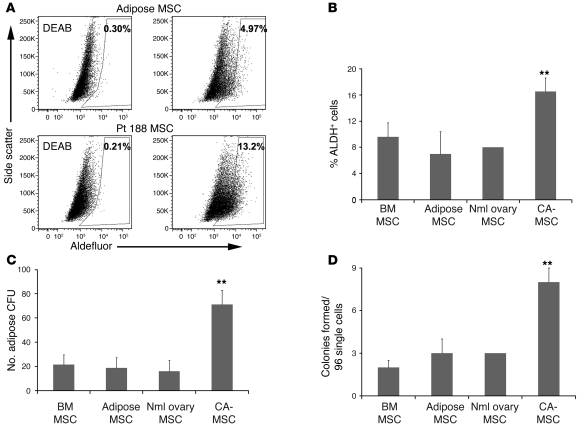
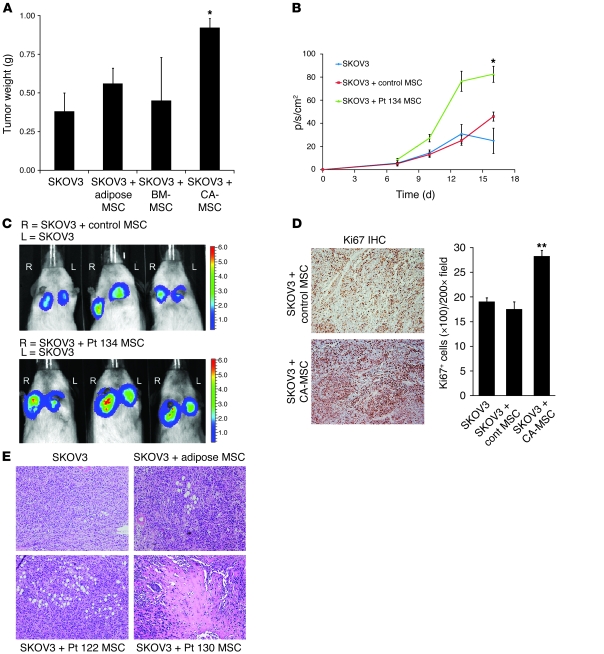
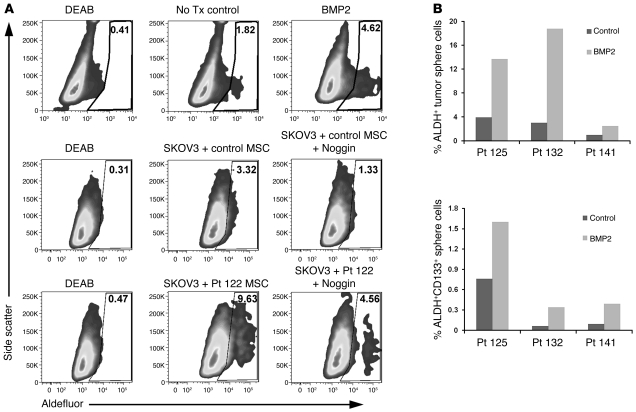
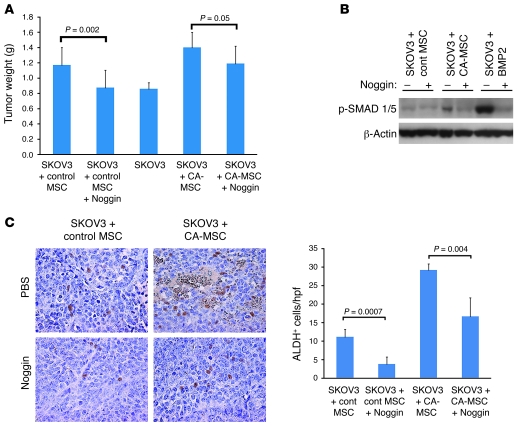
Accumulating evidence suggests that mesenchymal stem cells (MSCs) are recruited to the tumor microenvironment; however, controversy exists regarding their role in solid tumors. In this study, we identified and confirmed the presence of carcinoma-associated MSCs (CA-MSCs) in the majority of human ovarian tumor samples that we analyzed. These CA-MSCs had a normal morphologic appearance, a normal karyotype, and were nontumorigenic. CA-MSCs were multipotent with capacity for differentiating into adipose, cartilage, and bone. When combined with tumor cells in vivo, CA-MSCs promoted tumor growth more effectively than did control MSCs. In vitro and in vivo studies suggested that CA-MSCs promoted tumor growth by increasing the number of cancer stem cells. Although CA-MSCs expressed traditional MSCs markers, they had an expression profile distinct from that of MSCs from healthy individuals, including increased expression of BMP2, BMP4, and BMP6. Importantly, BMP2 treatment in vitro mimicked the effects of CA-MSCs on cancer stem cells, while inhibiting BMP signaling in vitro and in vivo partly abrogated MSC-promoted tumor growth. Taken together, our data suggest that MSCs in the ovarian tumor microenvironment have an expression profile that promotes tumorigenesis and that BMP inhibition may be an effective therapeutic approach for ovarian cancer.


Figures

Figure 1
Figure 1. Isolation of ovarian CA-MSCs.
(A) Photograph of mixed primary ovarian tumor culture (top left) and the resultant, distinct purified colonies of epithelial tumors cells or CA-MSCs. Original magnification, ×100. (B) FACS analysis of primary ovarian tumor ascites, demonstrating CD44+CD73+CD90+ cells. (C) qRT-PCR to confirm CA-MSC purity. CA-MSC lines have no significant expression of the indicated endothelial or epithelial cell markers. Whole primary tumor mRNA (tumor) was used as a positive control. Expression levels were relative to the sample with maximal expression defined as 1. Nml, normal. (D) CA-MSCs demonstrate multipotent differentiation capacity in differential culture conditions. Specific cell stains used were Alizarin Red-S for bone, alcian blue for cartilage, and Oil Red O for adipose. Original magnification, ×100. Pt, patient.
Figure 2
Figure 2. CA-MSCs demonstrate increased stem cell capacity.
(A) FACS analysis demonstrating that CA-MSCs have an increased percentage of Aldefluor+ cells compared with adipose MSC controls. Numbers represent the percentage of Aldefluor+ cells. (B) Average percentage of ALDH+ cells in indicated control cells and CA-MSCs. (C) Adipose CFUs formed per 50,000 cells in the indicated control cells and CA-MSCs. (D) Single cell clones generated from the indicated control cells and CA-MSCs. (AD) BM-MSCs, n = 2; adipose MSCs, n = 3; normal ovary MSCs, n = 1; CA-MSCs, n = 5. **P < 0.05. Error bars represent standard deviations.
Figure 3
Figure 3. CA-MSCs promote ovarian tumorigenesis more than control MSCs.
(A) Tumor weights of SKOV3 tumors grown alone or with the indicated MSCs (SKOV3 plus control MSCs, n = 10; SKOV3 plus CA-MSCs, n = 20; pooled results, n = 5 for 4 CA-MSC cell lines). Results are representative of 2 independent experiments. (B and C) Bioluminescent-based tumor growth curve of SKOV3-luciferase tumors alone or in combination with the indicated MSCs (control MSCs, n = 10 and Pt 134 MSCs, n = 8, in 2 independent experiments). Signal intensity mapping for tumors is shown (p/s/cm2). (D) Ki67 immunohistochemistry and quantification from SKOV3+adipose MSC and SKOV3+CA-MSC tumors. Original magnification, ×100. Cont, control. (E) Hematoxylin and eosin stains of paraffin-embedded tumor specimens grown with MSCs or CA-MSCs, demonstrating tumor adipocytes (top right and bottom left). Tumors with CA-MSCs demonstrated areas of early bone formation (bottom right). Original magnification, ×40. All results represent means with standard deviations. *P < 0.01; **P < 0.001.
Figure 4
Figure 4. CA-MSCs increase the number of CSCs.
(A) SKOV3 cells, cocultured with either adipose MSCs or CA-MSCs, demonstrating sphere formation in the presence of CA-MSCs. Original magnification, ×100. (B) Average number of spheres per low-powered field (LPF) in SKOV3 cells with control versus CA-MSCs. **P < 0.001. (C) Representative Aldefluor analysis of DsRED SKOV3 cells either alone or cocultured with Adipose MSCs or CA-MSCs and averages from 3 independent experiments. DEAB was used as a negative control. Numbers represent the percentage of Aldefluor+ cells. *P < 0.01. (D) Representative FACS analysis demonstrating the percentage of CD133+CD73 ALDH+ A2780 cells cocultured with adipose MSCs or CA-MSCs and the average percentage of ALDH+ cells or ALDH+CD133+ A2780 cells. Numbers in the top left quadrant represent the number of CD133+/CD73 cells; numbers in the top right quadrant represent the number of CD133+/Aldefluor+ cells. Error bars represent standard deviations.
Figure 5
Figure 5. CA-MSCs have a gene expression profile distinct from that of control MSCs.
(A) Heat map of gene expression of MSC-associated gene expression in CA-MSCs, adipose control MSCs (lot 1, 2, 3), and control MSCs cultured with tumor-conditioned media from either SKOV3 or Hey1 ovarian tumor cells. The blue line indicates genes differentially expressed in CA-MSCs and MSCs treated with tumor-conditioned media. The orange bar indicates genes that appear to be uniquely expressed in CA-MSCs. Avg, average; max, maximum. (B) qRT-PCR using independently derived gene-specific primers performed to confirm differential expression of the indicated genes in control versus 4 CA-MSC–derived cell isolates (top), pooled analysis of qRT-PCR results (middle), and BMP2 expression in controls, cultured CA-MSCs, and FACS-isolated CA-MSCs (bottom). Tum cond media, tumor-conditioned media. (C) Western blot demonstrating increased BMP2 protein expression in adipose control MSCs and CA-MSCs. Quantification of BMP2 band intensity from immunoblotting is shown with average and standard deviation indicated. **P = 0.03. (D) Western blot detection of p-SMAD 1/5 before and after treatment with BMP2 in the presence or absence of the BMP inhibitor Noggin.
Figure 6
Figure 6. BMP2 increases the percentage of ALDH+ and ALDH+CD133+ CSCs.
(A) FACS analysis of SKOV3 cells cultured with either PBS (No Tx Control) or BMP2 (100 ng/ml) for 72 hours. FACS analysis of SKOV3 cells cultured in a 1:1 ratio with either adipose control MSCs or CA-MSCs in the absence or presence of Noggin. DEAB control is shown. Numbers represent the percentage of Aldefluor+ cells. (B) Results of FACS analysis of primary tumor spheres from 3 different patients treated with PBS (control) or BMP2 (100 ng/ml) for 7 days. The percentage of ALDH+ cells and ALDH+CD133+ cells for each patient sample is shown.
Figure 7
Figure 7. Noggin therapy abrogates MSC-mediated tumorigenesis with an associated decrease in ALDH+ cells.
(A) At euthanasia, average tumor weights of SKOV3 tumors grown with adipose MSCs (control) or CA-MSCs and treated every 48 hours with Noggin or PBS (n = 8 in each group in 2 independent experiments). (B) Western blot demonstrating p-SMAD 1/5 and actin controls in the tumors with and without Noggin therapy or BMP2 treatment. (C) Representative ALDH1 immunohistochemistry and quantification of ALDH1 expression in the indicated control and Noggin-treated tumors. The number of ALDH+ cells were counted in 10 sections from 4 tumors in each treatment group. Average and standard deviations are indicated with P values. Original magnification, ×200. hpf, high-powered field.

References

    1. Stagg J. Mesenchymal stem cells in cancer. Stem Cell Reviews. 2008;4(2):119–124. doi: 10.1007/s12015-008-9030-4. - DOI - PubMed
    1. Qiao L, Xu Z-L, Zhao T-J, Ye L-H, Zhang X-D. Dkk-1 secreted by mesenchymal stem cells inhibits growth of breast cancer cells via depression of Wnt signalling. Cancer Letters. 2008;269(1):67–77. doi: 10.1016/j.canlet.2008.04.032. - DOI - PubMed
    1. Zhu Y, et al. Human mesenchymal stem cells inhibit cancer cell proliferation by secreting DKK-1. Leukemia. 2009;23(5):925–933. doi: 10.1038/leu.2008.384. - DOI - PubMed
    1. Lu Y-R, et al. The growth inhibitory effect of mesenchymal stem cells on tumor cells in vitro and in vivo. Cancer Biol Ther. 2008;7(2):245–251. - PubMed
    1. Ramasamy R, Lam EWF, Soeiro I, Tisato V, Bonnet D, Dazzi F. Mesenchymal stem cells inhibit proliferation and apoptosis of tumor cells: impact on in vivo tumor growth. Leukemia. 2007;21(2):304–310. doi: 10.1038/sj.leu.2404489. - DOI - PubMed

Publication types

Substances