. 2011 Aug;121(8):3133-43.
doi: 10.1172/JCI43598.

Identification of an IFN-γ/mast cell axis in a mouse model of chronic asthma

Affiliations

Identification of an IFN-γ/mast cell axis in a mouse model of chronic asthma

Mang Yu et al. J Clin Invest. 2011 Aug.

Abstract

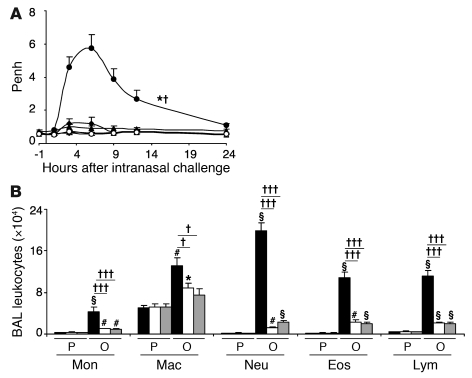
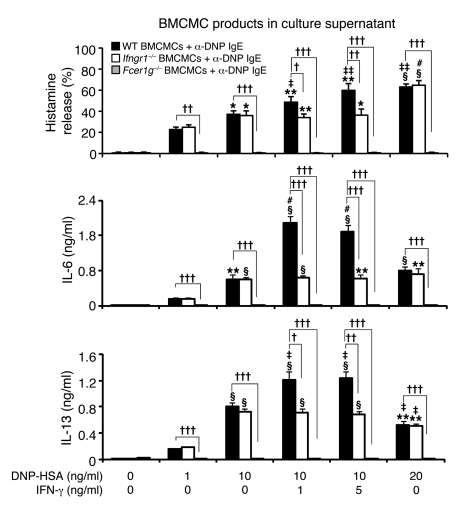
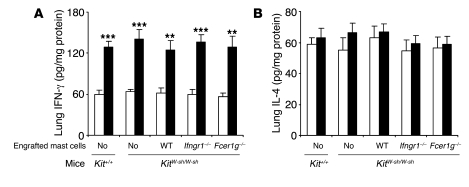
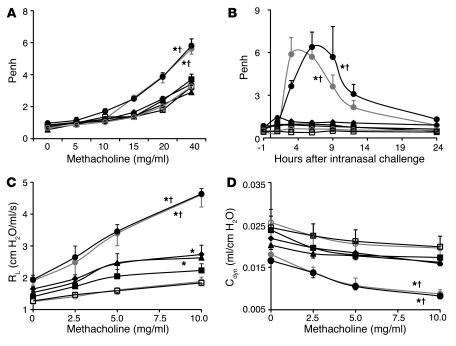
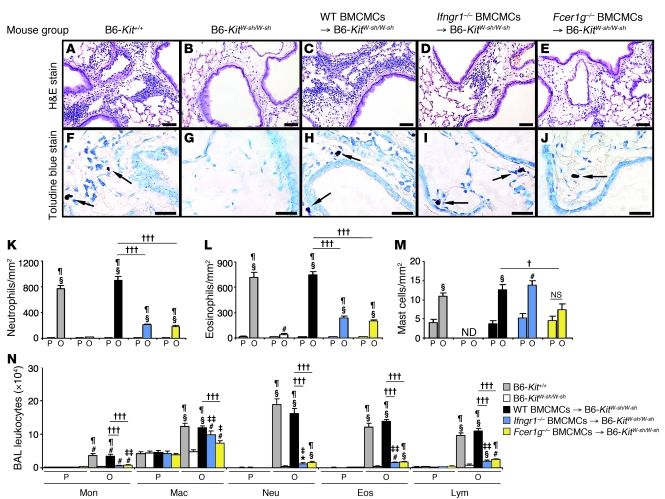
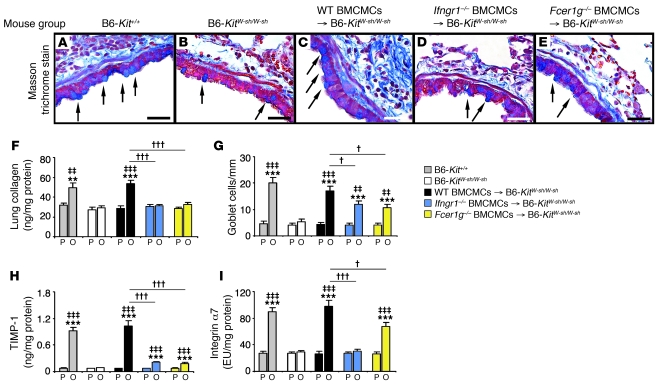
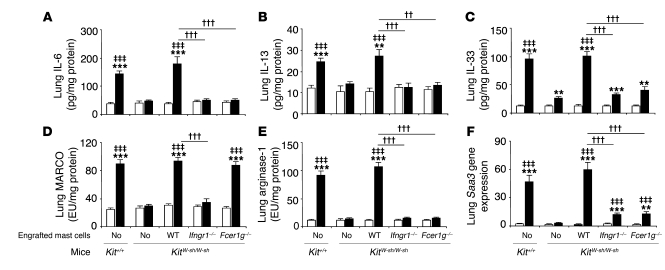
Asthma is considered a Th2 cell–associated disorder. Despite this, both the Th1 cell–associated cytokine IFN-γ and airway neutrophilia have been implicated in severe asthma. To investigate the relative contributions of different immune system components to the pathogenesis of asthma, we previously developed a model that exhibits several features of severe asthma in humans, including airway neutrophilia and increased lung IFN-γ. In the present studies, we tested the hypothesis that IFN-γ regulates mast cell function in our model of chronic asthma. Engraftment of mast cell–deficient KitW(-sh/W-sh) mice, which develop markedly attenuated features of disease, with wild-type mast cells restored disease pathology in this model of chronic asthma. However, disease pathology was not fully restored by engraftment with either IFN-γ receptor 1–null (Ifngr1–/–) or Fcε receptor 1γ–null (Fcer1g–/–) mast cells. Additional analysis, including gene array studies, showed that mast cell expression of IFN-γR contributed to the development of many FcεRIγ-dependent and some FcεRIγ-independent features of disease in our model, including airway hyperresponsiveness, neutrophilic and eosinophilic inflammation, airway remodeling, and lung expression of several cytokines, chemokines, and markers of an alternatively activated macrophage response. These findings identify a previously unsuspected IFN-γ/mast cell axis in the pathology of chronic allergic inflammation of the airways in mice.


Figures

Figure 1
Figure 1. Influence of IFN-γ or IFN-γR1 on the development of airway responses and leukocytes in BAL fluid.
(A) Airway responses (assessed as Penh) measured in OVA-sensitized and -challenged WT C57BL/6 (filled circles), Ifng–/– (filled triangles), and Ifngr1–/– (filled diamonds) mice, and in PBS-treated C57BL/6 (open circles), Ifng–/– (open triangles), and Ifngr1–/– (open diamonds) mice at 1 hour before and 1, 3, 6, 9, 12, and 24 hours after the ninth OVA or PBS challenge; n = 6–12 per group. (B) Numbers of leukocytes in BAL fluid from the right lung of C57BL/6 (black bars), Ifng–/– (white bars), or Ifngr1–/– (gray bars) mice following OVA sensitization and challenge (O) or PBS treatment (P). *P < 0.05, #P < 0.01, §P < 0.001 versus corresponding PBS-treated controls; P < 0.05, †††P < 0.001 versus each of the other groups (in A) or versus the groups indicated (n = 6–12 per group). Mon, monocytes; Mac, macrophages; Neu, neutrophils; Eos, eosinophils; Lym, lymphocytes.
Figure 2
Figure 2. Influence of IFN-γ on the expression of mast cell function in vitro.
Culture supernatants of anti-DNP IgE-sensitized BMCMCs from WT C57BL/6 (black bars), Ifngr1–/– (white bars), or Fcer1g–/– (gray bars) mice were collected 1 hour (for calculation of % histamine release) or 24 hours (for measurement of secreted cytokines) after addition of DNP-HSA or DNP/IFN-γ. Data were calculated from results pooled from 3 independent experiments, each of which gave similar results. IL-6 levels in supernatants collected from the cultures of WT BMCMCs stimulated with 1 or 5 ng/ml of IFN-γ in the absence of DNP-HSA were 0.009 ± 0.002 or 0.007 ± 0.002 ng/ml; the corresponding IL-13 levels were 0.015 ± 0.003 or 0.018 ± 0.004 ng/ml, respectively. *P < 0.05, **P < 0.01, §P < 0.001 versus values from the corresponding BMCMCs stimulated with 1 ng/ml DNP-HSA alone. P < 0.05, ††P < 0.01, †††P < 0.001 versus group indicated. P < 0.05, ‡‡P < 0.01, #P < 0.001 versus values from the corresponding BMCMCs stimulated with 10 ng/ml DNP-HSA alone. n = 3 per group.
Figure 3
Figure 3. Lung expression of IFN-γ and IL-4.
(A and B) Tissues were sampled 24 hours after the 9th OVA or PBS challenge. White bars, PBS-treated groups; black bars, OVA-sensitized and -challenged groups. **P < 0.01, ***P < 0.001 versus the corresponding PBS controls; n = 6–10 per group.
Figure 4
Figure 4. Airway responses following i.n. challenge with antigen (OVA) or PBS.
(A) Penh responses to aerosolized methacholine measured 24 hours after the eighth OVA or PBS challenge. (B) OVA or PBS challenge–induced changes in Penh measured 1 hour before and 1, 3, 6, 9, 12, and 24 hours after the ninth OVA or PBS challenge. (C and D) Changes in RL and Cdyn to aerosolized methacholine administered 24 hours after the ninth OVA or PBS challenge. Data are from OVA-sensitized and challenged WT C57BL/6 (filled gray circles), mast cell–deficient C57BL/6-KitW-sh/W-sh (filled black squares), C57BL/6 BMCMCs→ C57BL/6-KitW-sh/W-sh (filled black circles), Ifngr1–/– BMCMCs→ C57BL/6-KitW-sh/W-sh (filled black diamonds), and Fcer1g–/– BMCMCs→ C57BL/6-KitW-sh/W-sh (filled black triangles) mice and the corresponding PBS-treated control mice (open gray circles or open squares [shown here and in Supplemental Figure 4, representing control data for WT C57BL/6 and mast cell–deficient C57BL/6-KitW-sh/W-sh mice]). See Supplemental Figure 4 for the control data for the different groups of mast cell–engrafted C57BL/6-KitW-sh/W-sh mice. *P < 0.05 versus the corresponding PBS controls; P < 0.05 versus each of the other groups except the OVA-sensitized and challenged C57BL/6 or C57BL/6 BMCMCs→ C57BL/6-KitW-sh/W-sh group. n = 6–12 per group (A and B); n = 4–6 per group (C and D).
Figure 5
Figure 5. Features of lung inflammation.
H&E-stained (AE) and toluidine blue–stained (FJ) tissue sections demonstrating peribronchial inflammatory infiltrates and mast cells (indicated with arrows) in the lungs 24 hours after the ninth OVA challenge; (KM) numbers of various cell types in the lungs; (N) numbers of leukocytes in BAL fluid recovered from the right lungs 24 hours after the ninth OVA or PBS challenge. B6, C57BL/6. Data are from WT C57BL/6 (gray bars), mast cell–deficient C57BL/6-KitW-sh/W-sh (white bars), C57BL/6 BMCMCs→ C57BL/6-KitW-sh/W-sh (black bars), Ifngr1–/– BMCMCs→ C57BL/6-KitW-sh/W-sh (blue bars), and Fcer1g–/– BMCMCs→ C57BL/6-KitW-sh/W-sh (yellow bars) mice and the corresponding PBS-treated control mice. *P < 0.05, #P < 0.01, §P < 0.001 versus the corresponding PBS controls; P < 0.05, ‡‡P < 0.01, P < 0.001 versus OVA-sensitized and -challenged KitW-sh/W-sh mice; P < 0.05, †††P < 0.001 versus group indicated. ND, not detected. n = 6 to 12 per group. Scale bars: 50 μm.
Figure 6
Figure 6. Features of airway wall remodeling.
(AE) Masson’s trichrome–stained tissue sections demonstrating mucus-secreting goblet cells (blue, indicated with arrows) and subepithelial fibrosis (collagen stains blue). (FI) Collagen levels in the lung (F), numbers of goblet cells along the airway epithelium (G), and levels of lung TIMP-1 (H) and integrin α7 (I). Data are from WT C57BL/6 (gray bars), mast cell–deficient C57BL/6-KitW-sh/W-sh (white bars), C57BL/6 BMCMCs→ C57BL/6-KitW-sh/W-sh (black bars), Ifngr1–/– BMCMCs→ C57BL/6-KitW-sh/W-sh (blue bars), and Fcer1g–/– BMCMCs→ C57BL/6-KitW-sh/W-sh (yellow bars) mice and the corresponding PBS-treated control mice. **P < 0.01, ***P < 0.001 versus the corresponding PBS controls; ‡‡P < 0.01, ‡‡‡P < 0.001 versus OVA-sensitized and -challenged KitW-sh/W-sh mice; P < 0.05, †††P < 0.001 versus group indicated. n = 6–10 per group in FI. Scale bars (in AE): 30 μm. EU, experimental units, with the arbitrary value of 100 EU assigned to the mean value for the integrin α7 content in the lung protein extract of 4 randomly selected WT C57BL/6 mice in the OVA-sensitized and -challenged group.
Figure 7
Figure 7. Levels of inflammatory cytokines and other molecules in the lung.
Levels of IL-6 (A), IL-13 (B), IL-33 (C), MARCO (D), and arginase-1 protein (E) and the relative levels of Saa3 mRNA (F) were measured in the lungs 24 hours after the ninth OVA or PBS challenge in WT C57BL/6 (Kit+/+), mast cell–deficient C57BL/6-KitW-sh/W-sh (KitW-sh/W-sh), C57BL/6 (WT) BMCMCs→ C57BL/6-KitW-sh/W-sh, Ifngr1–/– BMCMCs→ C57BL/6-KitW-sh/W-sh, and Fcer1g–/– BMCMCs→ C57BL/6-KitW-sh/W-sh mice and the corresponding PBS-treated control mice. White bars: PBS-treated groups; black bars: OVA-sensitized and -challenged groups. **P < 0.01, ***P < 0.001 versus the corresponding PBS controls; ‡‡‡P < 0.001 versus OVA-sensitized and -challenged KitW-sh/W-sh mice; ††P < 0.01, †††P < 0.001 versus group indicated. n = 6–10 per group. EU, experimental units, with the arbitrary value of 100 EU assigned to the values for the MARCO (D) or arginase-1 (E) content in the lung protein extract of 4 randomly selected WT C57BL/6 mice in the OVA-sensitized and -challenged group.

References

    1. Busse WW, Lemanske RF., Jr Asthma. N Engl J Med. 2001;344(5):350–362. doi: 10.1056/NEJM200102013440507. - DOI - PubMed
    1. Umetsu DT, McIntire JJ, Akbari O, Macaubas C, DeKruyff RH. Asthma: an epidemic of dysregulated immunity. Nat Immunol. 2002;3(8):715–720. doi: 10.1038/ni0802-715. - DOI - PubMed
    1. Wills-Karp M. Immunologic basis of antigen-induced airway hyperresponsiveness. Annu Rev Immunol. 1999;17:255–281. doi: 10.1146/annurev.immunol.17.1.255. - DOI - PubMed
    1. Holgate ST. Novel targets of therapy in asthma. Curr Opin Pulm Med. 2009;15(1):63–71. doi: 10.1097/MCP.0b013e32831da867. - DOI - PubMed
    1. Fahy JV. Eosinophilic and neutrophilic inflammation in asthma: insights from clinical studies. Proc Am Thorac Soc. 2009;6(3):256–259. doi: 10.1513/pats.200808-087RM. - DOI - PubMed