. 2011 Jun;9(6):e1001086.
doi: 10.1371/journal.pbio.1001086. Epub 2011 Jun 28.

Substantial histone reduction modulates genomewide nucleosomal occupancy and global transcriptional output

Affiliations

Substantial histone reduction modulates genomewide nucleosomal occupancy and global transcriptional output

Barbara Celona et al. PLoS Biol. 2011 Jun.

Abstract

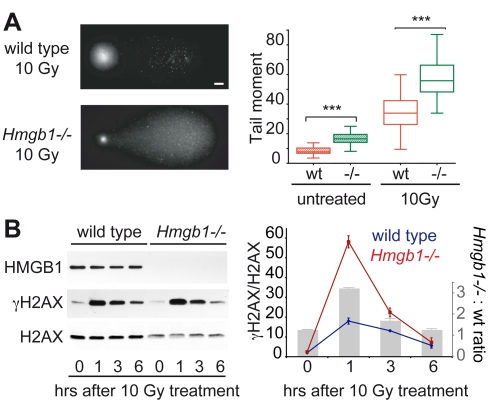
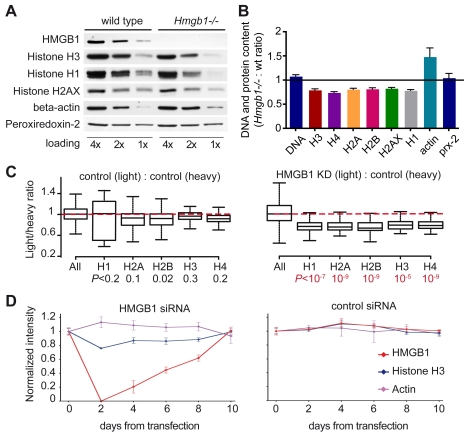
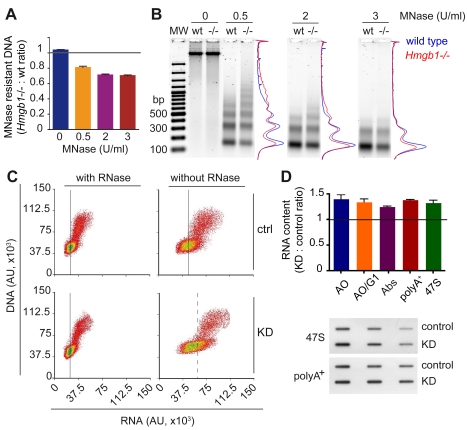
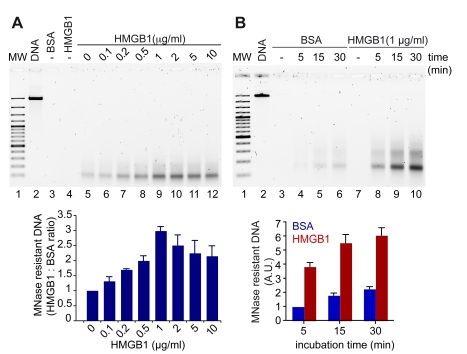
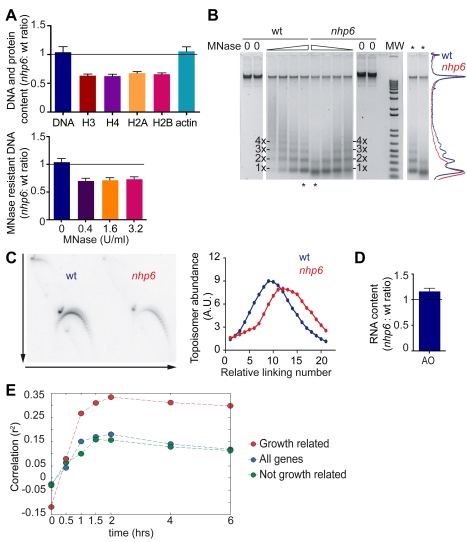
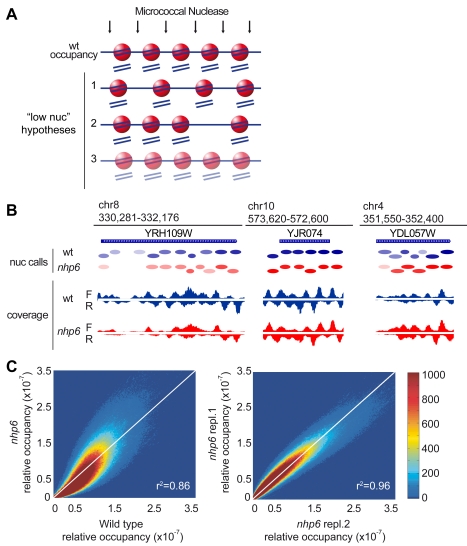
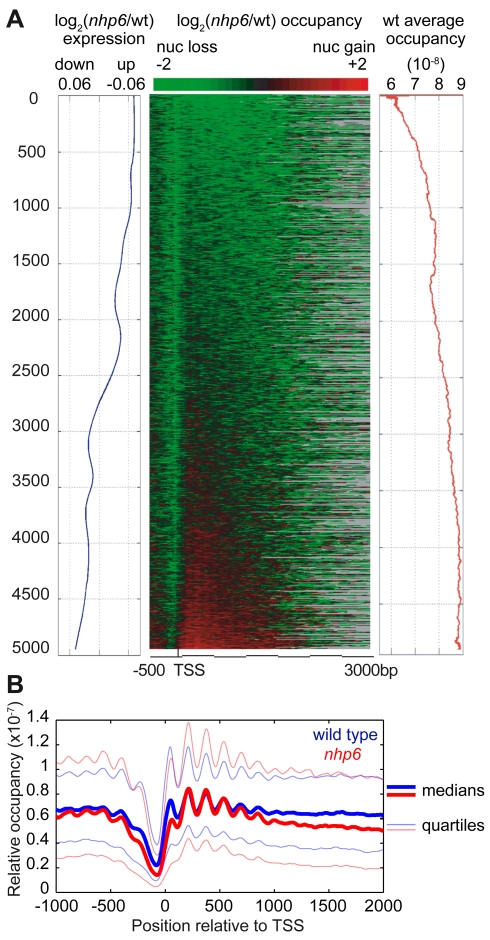
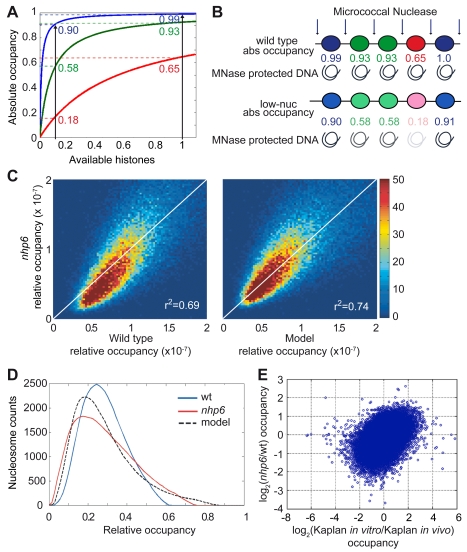
The basic unit of genome packaging is the nucleosome, and nucleosomes have long been proposed to restrict DNA accessibility both to damage and to transcription. Nucleosome number in cells was considered fixed, but recently aging yeast and mammalian cells were shown to contain fewer nucleosomes. We show here that mammalian cells lacking High Mobility Group Box 1 protein (HMGB1) contain a reduced amount of core, linker, and variant histones, and a correspondingly reduced number of nucleosomes, possibly because HMGB1 facilitates nucleosome assembly. Yeast nhp6 mutants lacking Nhp6a and -b proteins, which are related to HMGB1, also have a reduced amount of histones and fewer nucleosomes. Nucleosome limitation in both mammalian and yeast cells increases the sensitivity of DNA to damage, increases transcription globally, and affects the relative expression of about 10% of genes. In yeast nhp6 cells the loss of more than one nucleosome in four does not affect the location of nucleosomes and their spacing, but nucleosomal occupancy. The decrease in nucleosomal occupancy is non-uniform and can be modelled assuming that different nucleosomal sites compete for available histones. Sites with a high propensity to occupation are almost always packaged into nucleosomes both in wild type and nucleosome-depleted cells; nucleosomes on sites with low propensity to occupation are disproportionately lost in nucleosome-depleted cells. We suggest that variation in nucleosome number, by affecting nucleosomal occupancy both genomewide and gene-specifically, constitutes a novel layer of epigenetic regulation.


Conflict of interest statement

The authors have declared that no competing interests exist.

Figures

Figure 1
Figure 1. Hmgb1−/− nuclei are more accessible to DNA damage by ionizing radiation.
(A) Left: visualization of DNA breaks by alkaline Comet Assay in G1-synchronised wild type and Hmgb1−/− cells after 10 Gy γ-ray irradiation. Bar: 10 µm. Right: quantification of DNA fragmentation before and after irradiation. Box plots: top and bottom mark the 25th and 75th percentiles; inner line, median; whiskers, maximum and minimum values. Tail moment values of wild type and Hmgb1−/− MEFs are statistically different both before and after irradiation (p<10−4, n = 50, t test). (B) Quantification of γH2AX in G1-synchronised wild type and Hmgb1−/− MEFs. Cells were irradiated as indicated in (A) and kept in culture for the indicated time before cell lysis. Western blotting for HMGB1, γH2AX, and H2AX were performed on equal amounts of total cell lysates. Data are expressed as γH2AX band intensities, normalized to total H2AX band intensities; error bars, SD of technical replicates in a representative experiment out of three performed. Quantifications were performed on images with different exposures within the linear part of the dynamic range. The histogram in gray shows the ratio of H2AX phosphorylation between Hmgb1−/− and wild type cells.
Figure 2
Figure 2. Hmgb1−/− cells contain a reduced amount of histones.
(A) Western blot of serial 1∶2 dilutions starting from 50,000 G0/G1 synchronized cells. (B) Ratios of band intensities from the blots in (A) and two other similar experiments. Histone and actin ratios are significantly different from 1 (p<0.05, Wilcoxon test), while DNA and peroxiredoxin-2 ratios are not. Error bars represent SEM. (C) SILAC analysis of cellular histone contents. The box-plots represent Light/Heavy ratios for the whole proteome (“all,” all peptides) and non-modified peptides from histones. Left panel: control experiment where light- and heavy-labelled control cells were mixed (number of peptides: all peptides = 34,691, H1 = 39, H2A = 97, H2B = 70, H3 = 53, H4 = 147; mean values ± SD: H1 = 0.883±0.517, H2A = 0.882±0.168, H2B = 0.859±0.254, H3 = 0.942±0.162, H4 = 0.911±0.106). Right panel: experiment where light HeLa KD cells were mixed with heavy control cells (number of peptides: all peptides = 26,823, H1 = 42, H2A = 66, H2B = 48, H3 = 34, H4 = 81; mean values ± SD: H1 = 0.740±0.305, H2A = 0.769±0.185, H2B = 0.713±0.165, H3 = 0.763±0.116, H4 = 0.781±0.133). Probabilities are calculated using Wilcoxon test. (D) Quantification of the indicated proteins in HeLa cells transiently transfected with HMGB1 siRNA (left) or control firefly luciferase siRNA (right). Samples were collected at the indicated times after siRNA transfection and evaluated by western blotting. Error bars, SD from a representative experiment out of three performed.
Figure 3
Figure 3. Cells lacking HMGB1 contain fewer nucleosomes and more RNA transcripts.
(A) Residual (nucleosome-protected) DNA obtained from Hmgb1−/− and wild type MEFs after digestion with increasing MNase concentrations. Error bars, SEM from three biological replicates. (B) Electrophoretic separation and densitometric analysis of DNA samples from 250,000 wild type and Hmgb1−/− MEFs after digestion with 0, 0.5, and 2 U/ml of MNase. MW: 100 bp ladder. (C) FACS analysis of HeLa control (upper panels) and KD cells (lower panels) stained with Acridine Orange (AO), with or without prior RNase treatment (left and right, respectively). Fluorescence from AO bound to DNA (y-axis, 530/30 nm) and to RNA (x-axis, 610/20 nm). Black vertical lines (continuous and dashed) indicate the arithmetic means of RNA fluorescence in G1 cells. (D) Quantification of total RNA content in control and KD HeLa cells by FACS (cycling and G1) and by 260 nm absorbance of RNA extracted from a defined number of cells. Quantification of polyA+ mRNA and 47S rRNA precursor by RNA slot blot hybridization with specific probes (lower panel, details in Material and Methods). Error bars, SEM of three biological replicates. RNA ratios are significantly different from 1 (p<0.05, Wilcoxon test).
Figure 4
Figure 4. HMGB1 promotes the assembly of chromatin in vitro.
(A) Chromatin was assembled in vitro on linear DNA using purified histones, hNAP1, ACF, and increasing amounts of HMGB1 protein; then it was digested with MNase. The residual DNA after digestion was electrophoresed on a 1.5% agarose gel (upper panel) and quantified with PicoGreen (normalized to the reaction containing BSA, lower panel). Error bars, SD of three replicates. (B) Chromatin was assembled in the presence of a fixed amount of HMGB1 (1 µg/ml), or BSA as control, for the indicated time points. Electrophoresis (upper panel) and quantification by PicoGreen (lower panel) of the residual DNA after digestion with MNase are shown. Error bars, SD of three replicates. MW: 100 bp ladder.
Figure 5
Figure 5. nhp6 cells contain fewer nucleosomes and more RNA transcripts.
(A) Quantification of histone content (upper panel) from western blots of wild type and nhp6 cells; the decreases in core histone contents are statistically significant (p<0.05, Wilcoxon test). Lower panel: residual (nucleosome-protected) DNA obtained from nhp6 and wild type cells after digestion with increasing MNase concentrations. Error bars represent SEM from three biological replicates. (B) Electrophoretic separation of DNA samples from 3×10⁸ wild type and nhp6 cells after MNase digestion (from 6.4 U/ml in 2× dilutions). The densitometric analysis of the central two lanes (asterisks) is shown on the right. (C) Topological analysis of yRp17 plasmid in wild type and nhp6 cells by 2D-electrophoresis in the presence of different amounts of chloroquine in orthogonal directions (arrows in the left panel). Quantification of the different DNA topoisomers is shown in the right panel. (D) RNA quantification in wild type and nhp6 cells by Acridine Orange staining. Error bars, SEM of three biological replicates. RNA ratio is significantly different from 1 (p<0.05 Wilcoxon test). (E) Correlation over time between gene expression profiles of UKY403 and nhp6 cells. Time 0 corresponds to the galactose to glucose shift for the UKY403 strain.
Figure 6
Figure 6. nhp6 cells have increased variability in nucleosome occupancy.
(A) Schematic diagrams representing possible distributions of nucleosomes in low-nucleosome conditions. Nucleosomes are depicted as red spheres, DNA as a blue line. In wild type cells five nucleosomes cover ∼1 kb of DNA (first row). The schemes represent a 20% reduction in nucleosome content: 4 nucleosomes can redistribute over 1 kb (hypothesis 1), or 1 nucleosomal site is left vacant (hypothesis 2), or all 5 sites are occupied by nucleosomes but only 80% of the time relative to the wild type (hypothesis 3). (B) High throughput sequencing of MNase-resistant DNA shown for three loci of the yeast genome; wild type (blue) and nhp6 cells (red). Ovals represent nucleosomes called by template filtering; colour saturation is proportional to relative occupancy. F and R: Forward (sense) and Reverse (anti-sense) reads. (C) Density dot plots showing the relative occupancy per bp. Left: wild type (x-axis) versus nhp6 cells (y-axis); right: two biological replicates of nhp6 cells. The colour of each point represents the number of base pairs that map to that point in the plot. Pearson correlation coefficients are shown in the right bottom corner of the plots.
Figure 7
Figure 7. Nucleosomal occupancy on yeast coding genes.
(A) Correlation between nucleosomal occupancy over genes and mRNA levels. Left, smoothed moving average of the expression fold changes for 4,945 genes. Center, genes aligned by their TSS were sorted by the log2 nhp6/wild type ratio of nucleosome occupancy. Gray is used for genes whose CDS is shorter than 3 kb. Right, wild type relative nucleosomal occupancy averaged over the entire gene. (B) Nucleosome coverage over 4,945 genes aligned by TSS. Thick blue and red lines indicate the median occupancy for wild type and nhp6 cells, respectively; the 0.25 and 0.75 quartiles are shown as blue and red thin lines.
Figure 8
Figure 8. Mathematical model describing nucleosomal occupancy.
(A) Affinity model based on saturation of nucleosomal sites. Since there are more DNA sites that can be assembled into nucleosomes than histone octamers, the occupancy of each site (y-axis) will be determined by the availability of non-nucleosomal histones (x-axis) and the relative dissociation constant (ki) of histones at that site (blue, low ki; green, medium ki; red, high ki). Upon decreasing the availability of histones (black vertical line on the left), the occupancy of sites with high dissociation constant decreases more than the occupancy of sites with low dissociation constant. This simple model resembles a Michaelis-Menten association, described by hyperbolic curves. (B) Absolute occupancies of hypothetical nucleosomal sites with high (blue), intermediate (green), and low (red) affinity in conditions of normal (wild type) or low nucleosome content. (C) Density dot plots showing relative occupancy of ∼50,000 nucleosomes in wild type (x-axis) versus nhp6 cells (y-axis) (left panel) and observed nhp6 nucleosome occupancy versus the occupancy predicted by the model (right panel). The colour of each point represents the number of nucleosomes that correspond to that point in the plot. Pearson correlation coefficients are shown in the right bottom corner of the plots. (D) Distribution of relative nucleosome occupancy measured in wild type (blue) and nhp6 cells (red) and predicted distribution in nhp6 cells by our model (black, dashed). (E) The scatterplot shows the comparison of changes in nucleosomal occupancy between our nhp6/wild type datasets (y-axis) and the in vitro/in vivo datasets from Kaplan et al. (x-axis). Each dot is a nucleosome as in (C), axes are in log2 scale. Correlation between the two pairs is r2 = 0.46 (p<10−6).

Comment in

References

    1. Kornberg R. D, Thomas J. O. Chromatin structure; oligomers of the histones. Science. 1974;184:865–868. - PubMed
    1. Li B, Carey M, Workman J. L. The role of chromatin during transcription. Cell. 2007;128:707–719. - PubMed
    1. Groth A, Rocha W, Verreault A, Almouzni G. Chromatin challenges during DNA replication and repair. Cell. 2007;128:721–733. - PubMed
    1. van Holde K. E. Chromatin; In: Rich A, editor. New York: Springer-Verlag; 1988. 497
    1. Feser J, Truong D, Das C, Carson J. J, Kieft J, et al. Elevated histone expression promotes life span extension. Mol Cell. 2010;39:724–735. - PMC - PubMed

Publication types

MeSH terms