. 2011 Jun;9(6):e1001093.
doi: 10.1371/journal.pbio.1001093. Epub 2011 Jun 28.

Counterfactual choice and learning in a neural network centered on human lateral frontopolar cortex

Affiliations

Counterfactual choice and learning in a neural network centered on human lateral frontopolar cortex

Erie D Boorman et al. PLoS Biol. 2011 Jun.

Abstract

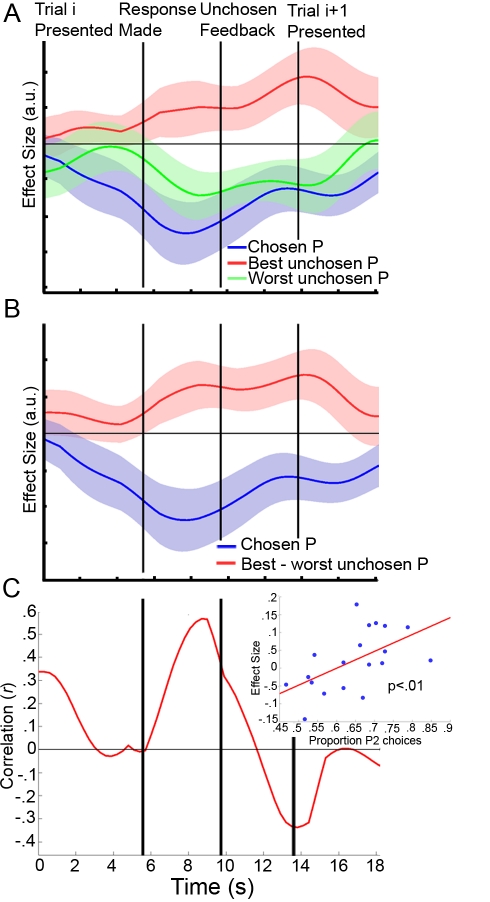
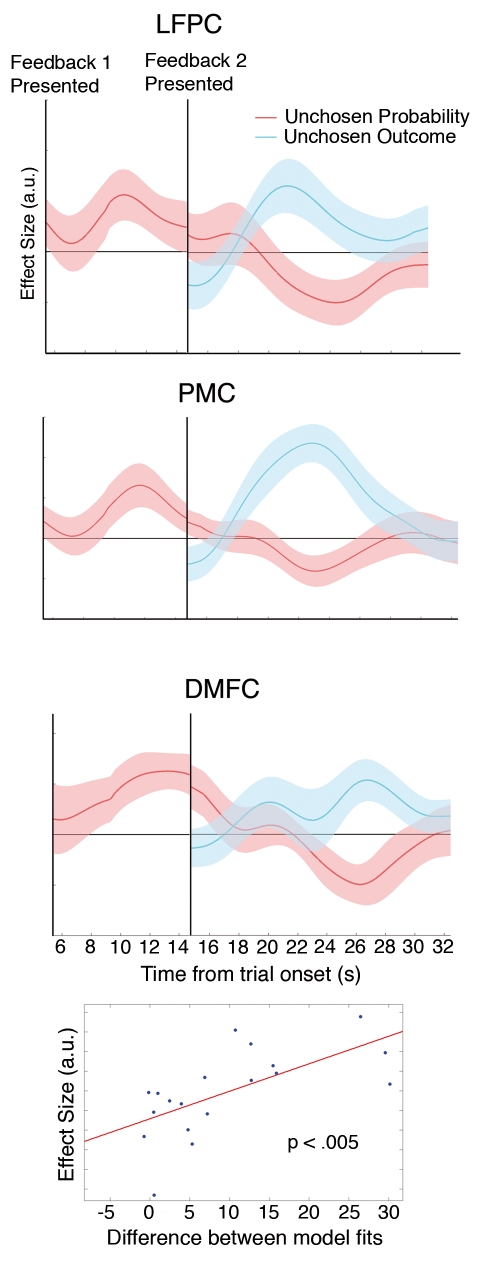
Decision making and learning in a real-world context require organisms to track not only the choices they make and the outcomes that follow but also other untaken, or counterfactual, choices and their outcomes. Although the neural system responsible for tracking the value of choices actually taken is increasingly well understood, whether a neural system tracks counterfactual information is currently unclear. Using a three-alternative decision-making task, a Bayesian reinforcement-learning algorithm, and fMRI, we investigated the coding of counterfactual choices and prediction errors in the human brain. Rather than representing evidence favoring multiple counterfactual choices, lateral frontal polar cortex (lFPC), dorsomedial frontal cortex (DMFC), and posteromedial cortex (PMC) encode the reward-based evidence favoring the best counterfactual option at future decisions. In addition to encoding counterfactual reward expectations, the network carries a signal for learning about counterfactual options when feedback is available-a counterfactual prediction error. Unlike other brain regions that have been associated with the processing of counterfactual outcomes, counterfactual prediction errors within the identified network cannot be related to regret theory. Furthermore, individual variation in counterfactual choice-related activity and prediction error-related activity, respectively, predicts variation in the propensity to switch to profitable choices in the future and the ability to learn from hypothetical feedback. Taken together, these data provide both neural and behavioral evidence to support the existence of a previously unidentified neural system responsible for tracking both counterfactual choice options and their outcomes.


Conflict of interest statement

The authors have declared that no competing interests exist.

Figures

Figure 1
Figure 1. Theoretical LFPC coding schemes.
Three hypothetical coding schemes for the LFPC are presented based on the findings of Boorman et al. (2009) . (A) According to one possible scheme, there is a positive correlation with reward probabilities of both of the unchosen options and a negative correlation with the reward probability of the chosen option. This scheme might be expected if the LFPC encodes the average of the two unchosen options relative to the chosen option. (B) In the second hypothetical system, there is a positive correlation with the reward probability of the best unchosen option and a negative correlation with the reward probability of the chosen option, while the worst option is discarded altogether. This would be consistent with a system encoding the opportunity cost of the decision. (C) In the third scheme presented, the reward probability of the best unchosen option is encoded positively, while the reward probability of both of the alternatives—the chosen and worst unchosen options—are encoded negatively. This system would be useful for appraising the worthiness of switching to the best pending option. Pch, chosen reward probability; P2, highest unchosen reward probability; P3, lowest unchosen reward probability.
Figure 2
Figure 2. Experimental task, reward probabilities, and expected values.
(A) Participants were faced with decisions between a face, whole body, and house stimulus, whose locations on the screen were randomized across trials. Participants were required to combine two pieces of information: the reward magnitude associated with each choice (which was shown in yellow beneath each stimulus) and the reward probability associated with each stimulus (which was not shown but could be estimated from the recent outcome history). When the yellow question mark appeared in the center of the screen, participants could indicate their choices by making right-hand button responses that corresponded to the location of the stimulus. The selected option was then highlighted by a red frame and the outcome was presented in the center of the screen: a green tick or a red X indicating a rewarded or unrewarded choice, respectively. If the choice was rewarded, the red points bar at the bottom of the screen updated towards the gold rectangular target in proportion to the number of points won. Each time the bar reached the target, participants were rewarded with £2. One of three conditions followed in pseudorandom order. In condition 1 the outcomes (rewarded or unrewarded) of the two unselected options were presented to the left of each stimulus, followed by the next trial. The points bar did not move in this condition. In conditions 2 and 3 participants had the opportunity to choose between the two options they had foregone at the first decision. In condition 2 the points associated with each stimulus remained the same as at the first decision. In condition 3 the points both changed to 50. In both conditions 2 and 3, when the yellow question mark appeared for the second time, participants indicated their second choices. This was followed immediately by feedback for both the chosen option, which once again was highlighted by a red frame, and the unchosen option, to the left of each stimulus. If the chosen option at the second decision was rewarded, the red points bar also moved towards the target in proportion to the number of points won. This second feedback phase was followed by presentation of the next trial. (B) The probability of reward associated with the face, body, and house stimuli as estimated by an optimal Bayesian learner (Experimental Procedures) are plotted over trials in cyan, magenta, and purple respectively. The underlying reward probabilities varied from trial-to-trial according to a fixed volatility. The reward probabilities associated with each option were de-correlated (Results; Figure 3A). (C) The expected value (reward probability×reward magnitude) associated with face, body, and house stimuli are plotted across trials in turquoise, light pink, and light purple, respectively. Reward magnitudes were selected so that the correlation between expected values was also limited.
Figure 3
Figure 3. Cross-correlation matrix and behavioral regression coefficients.
(A) Group cross-correlation matrix depicting mean correlation (r) across participants between reward probabilities, expected values, and reward magnitudes of chosen, next best, and worst options. (B) Mean regression coefficients (i.e., parameter estimates) related to the reward probabilities (left column) and reward magnitudes (right column) of the options with the highest, middle, and lowest expected value derived from a logistic regression on optimal choices (i.e., choices of the option with the highest expected value). Error bars represent standard error of the mean (s.e.m.).
Figure 4
Figure 4. The reward-based evidence favoring future choices of the best pending option.
(A) Axial and sagittal slices through z-statistic maps relating to the effect of reward probability of the unchosen option with the highest reward probability. Maps are thresholded at z>2.8, p<0.003 for display purposes, and are displayed according to radiological convention. (B) Time course of the effects of the reward probability for the chosen option (blue), the unchosen option with the highest reward probability (red), and the unchosen option with the lowest reward probability (green) are shown across the first decision-making and feedback phases. Time courses are not corrected for the hemodynamic lag. Thick lines: mean effect size. Shadows: ± s.e.m. Top row: LFPC; middle row: PMC; bottom row: DMFC.
Figure 5
Figure 5. LFPC effect predicts individual differences in behavior.
(A) Time course is plotted on the subset of trials during which there was no second decision across the entire trial. (B) Time course of LFPC effects of the best minus the worst unchosen probability (red) and the chosen probability (blue) in condition 1 are shown plotted across the trial. Conventions are the same as in Figure 4. (C) Between-subject correlation is plotted across the trial. The curve depicts the correlation (r) between the effect of the best minus the worst unchosen probability in the LFPC from conditions 2 and 3 (i.e., when there was a second decision) and the proportion of trials on which participants chose the option with the highest reward probability at the second decision. Inset: scatterplot of the effect size against the behavioral index at the time of the first peak in the effect of the best relative to the worst unchosen probability from condition 1 shown in (B). The time point selected for the scatterplot is thus unbiased with respect to the data used for the between-subject analysis.
Figure 6
Figure 6. Counterfactual prediction errors.
The time course of the fictive prediction error is plotted decomposed into its component parts: the expectation of reward for the unchosen option (pink) and the outcome of the unchosen option (cyan). The time course is plotted from the onset of the initial feedback for the first decision. There is a positive effect of the fictive outcome and a negative effect of the fictive expectation after the revelation of the outcome in each region. Conventions are the same as in Figure 4. Bottom row inset plots the counterfactual prediction error effect size in the PMC against the difference between the fit to behavior of the optimal and experiential Bayesian models, where each point represents a single subject.

Comment in

References

    1. Rangel A, Camerer C, Montague P. R. A framework for studying the neurobiology of value-based decision making. Nat Rev Neurosci. 2008;9:545–556. - PMC - PubMed
    1. Rushworth M. F, Behrens T. E. Choice, uncertainty and value in prefrontal and cingulate cortex. Nat Neurosci. 2008;11:389–397. - PubMed
    1. Seo H, Lee D. Cortical mechanisms for reinforcement learning in competitive games. Philos Trans R Soc Lond B Biol Sci. 2008;363:3845–3857. - PMC - PubMed
    1. Schoenbaum G, Roesch M. R, Stalnaker T. A, Takahashi Y. K. A new perspective on the role of the orbitofrontal cortex in adaptive behaviour. Nat Rev Neurosci. 2009;10:885–892. - PMC - PubMed
    1. Kable J. W, Glimcher P. W. The neurobiology of decision: consensus and controversy. Neuron. 2009;63:733–745. - PMC - PubMed

Publication types