. 2011 Jun;7(6):e1002067.
doi: 10.1371/journal.pgen.1002067. Epub 2011 Jun 30.

Identification of nine novel loci associated with white blood cell subtypes in a Japanese population

Affiliations

Identification of nine novel loci associated with white blood cell subtypes in a Japanese population

Yukinori Okada et al. PLoS Genet. 2011 Jun.

Abstract

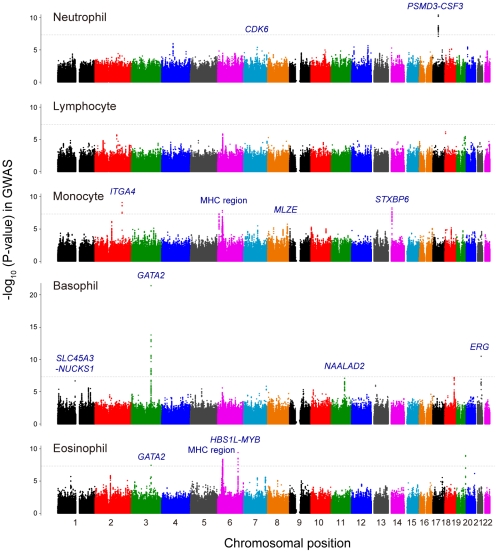
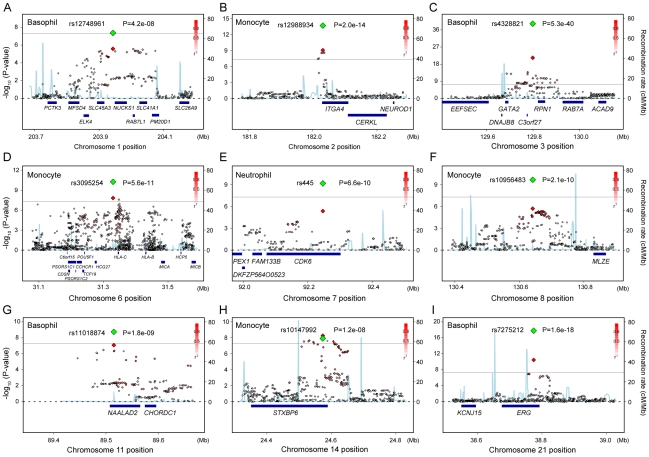
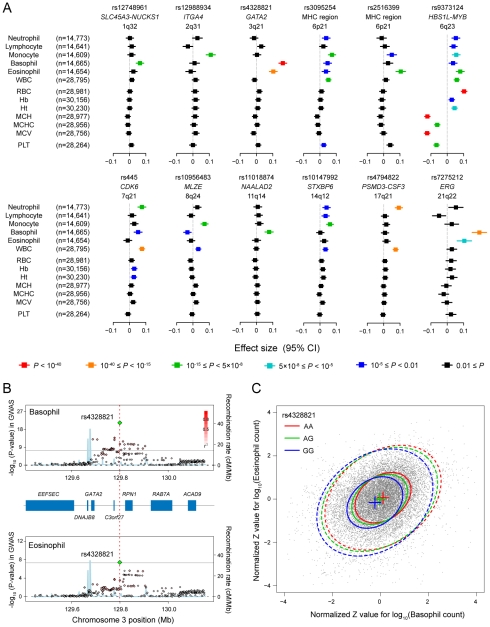
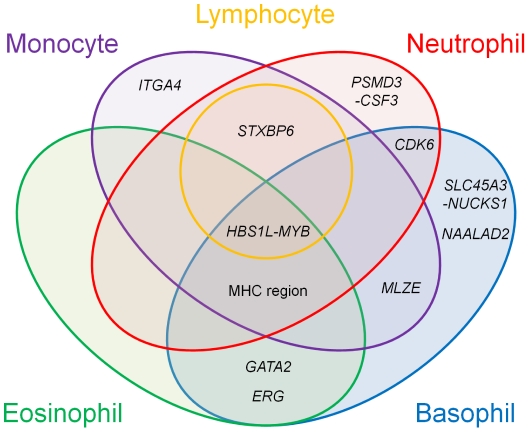
White blood cells (WBCs) mediate immune systems and consist of various subtypes with distinct roles. Elucidation of the mechanism that regulates the counts of the WBC subtypes would provide useful insights into both the etiology of the immune system and disease pathogenesis. In this study, we report results of genome-wide association studies (GWAS) and a replication study for the counts of the 5 main WBC subtypes (neutrophils, lymphocytes, monocytes, basophils, and eosinophils) using 14,792 Japanese subjects enrolled in the BioBank Japan Project. We identified 12 significantly associated loci that satisfied the genome-wide significance threshold of P<5.0×10(-8), of which 9 loci were novel (the CDK6 locus for the neutrophil count; the ITGA4, MLZE, STXBP6 loci, and the MHC region for the monocyte count; the SLC45A3-NUCKS1, GATA2, NAALAD2, ERG loci for the basophil count). We further evaluated associations in the identified loci using 15,600 subjects from Caucasian populations. These WBC subtype-related loci demonstrated a variety of patterns of pleiotropic associations within the WBC subtypes, or with total WBC count, platelet count, or red blood cell-related traits (n = 30,454), which suggests unique and common functional roles of these loci in the processes of hematopoiesis. This study should contribute to the understanding of the genetic backgrounds of the WBC subtypes and hematological traits.


Conflict of interest statement

The authors have declared that no competing interests exist.

Figures

Figure 1
Figure 1. Manhattan plots of the GWAS for the WBC subtypes.
Manhattan plots showing the -log10 (P-values) of the SNPs in the GWAS for neutrophil, lymphocyte, monocyte, basophil, and eosinophil counts. The genetic loci that satisfied the genome-wide significance threshold of P<5.0×10⁻⁸ in the combined study of the GWAS and the replication study were labeled in each of the traits. The gray horizontal line represents the threshold of P = 5.0×10⁻⁸.
Figure 2
Figure 2. Regional plots of the novel genetic loci associated with the WBC subtypes.
(A–I) Regional plots of the SNPs in the 9 novel loci identified in the GWAS for neutrophil, lymphocyte, monocyte, basophil, and eosinophil counts. Diamond-shaped dots represent -log10 (P-values) of the SNPs. The green dot indicates the P-value of the most significantly associated SNP in each of the loci in the combined study, and the red dot indicates its P-value in the GWAS. The density of the red color in the small-sized dots represents the r2 value with the most significantly associated SNP of the large-sized red dot. The blue line shows the recombination rates given by the HapMap database. The gray horizontal line represents the genome-wide significance threshold of P = 5.0×10⁻⁸. The lower part indicates the RefSeq genes in the locus. The plots were drawn using SNAP, version 2.1 .
Figure 3
Figure 3. Pleiotropic associations of the genetic loci associated with the WBC subtypes.
(A) Associations of the SNPs identified in the GWAS for the WBC subtypes with other WBC subtypes and hematological traits. Effect sizes of each SNP on the normalized traits are aligned vertically in each of the loci, and their color corresponds to the P-values of the associations according to the legend. WBC, total white blood cell count; RBC, red blood cell count; Hb, hemoglobin; Ht, hematocrit; MCV, mean corpuscular volume; MCH, mean corpuscular hemoglobin; MCHC, mean corpuscular hemoglobin concentration; PLT, platelet count; CI confidence interval. (B) Regional plots of the SNPs in the GWAS for the basophil (upper) and eosinophil (lower) counts in the GATA2 locus. Diamond-shaped dots represent -log10 (P-values) of the SNPs in the GWAS; green indicates the most significantly associated SNP, and the density of the red color represents the r2 value with the most significantly associated SNP. The blue line shows recombination rates given by the HapMap database. The gray horizontal line represents the genome-wide significance threshold of P = 5.0×10⁻⁸. The middle part indicates the RefSeq genes in the locus. The red vertical dashed line represents the concordance of the peaks of the association at rs4328821 in the GWAS. (C) Scatter plot of the subjects enrolled in the GWAS and the replication study based on the normalized Z values for the basophil and eosinophil counts. The center, 50% probable ellipse, and 95% probable ellipse of the subjects with AA (red) / AG (green) / GG (blue) genotypes of rs4328821 are indicated as crosses, solid ellipses, and dashed ellipses, respectively.
Figure 4
Figure 4. Venn diagram of the pleiotropic associations among the WBC subtypes.
Genetic loci identified in the GWAS for the WBC subtypes are classified based on the results of the pleiotropic association study among the WBC subtypes. The colors in the Venn diagram (red, orange, purple, aqua, and green) correspond to each of the WBC subtypes (neutrophils, lymphocytes, monocytes, basophils, and eosinophils, respectively). Pleiotropic associations with P<0.01 are included.

References

    1. Ronald H, Edward JB, Sanford JS, Bruce F, Leslie E, et al. Hematology: basic principles and practice (5th edition) Churchill: Livingstone/Elsevie. 2009.
    1. Fahy JV. Eosinophilic and neutrophilic inflammation in asthma: insights from clinical studies. Proc Am Thorac Soc. 2009;6:256–259. - PubMed
    1. Arinobu Y, Iwasaki H, Akashi K. Origin of basophils and mast cells. Allergol Int. 2009;58:21–28. - PubMed
    1. Sullivan BM, Locksley RM. Basophils: a nonredundant contributor to host immunity. Immunity. 2009;30:12–20. - PubMed
    1. Gauvreau GM, Ellis AK, Denburg JA. Haemopoietic processes in allergic disease: eosinophil/basophil development. Clin Exp Allergy. 2009;39:1297–1306. - PubMed

Publication types