

Proteomic analysis of pathways involved in estrogen-induced growth and apoptosis of breast cancer cells
- PMID: 21738574
- PMCID: PMC3124472
- DOI: 10.1371/journal.pone.0020410
Proteomic analysis of pathways involved in estrogen-induced growth and apoptosis of breast cancer cells
Abstract
Background: Estrogen is a known growth promoter for estrogen receptor (ER)-positive breast cancer cells. Paradoxically, in breast cancer cells that have been chronically deprived of estrogen stimulation, re-introduction of the hormone can induce apoptosis.
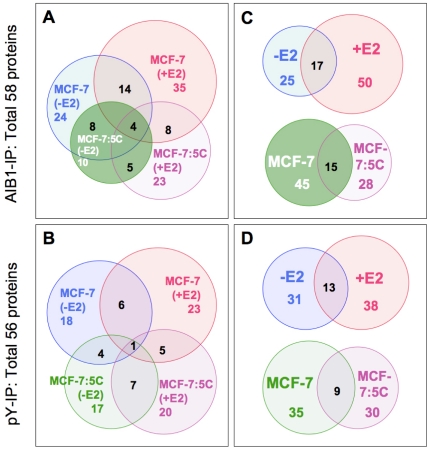
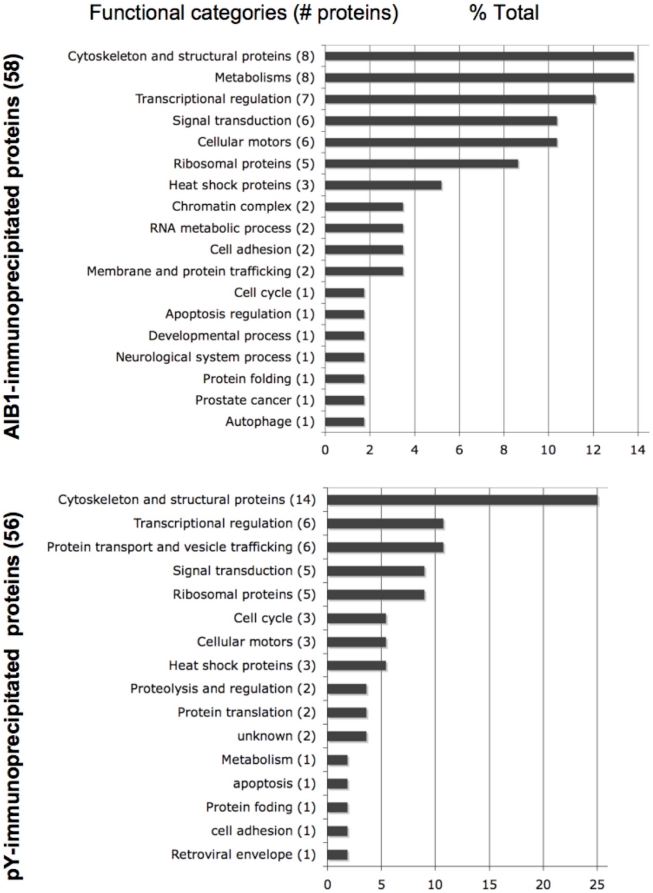
Methodology/principal findings: Here, we sought to identify signaling networks that are triggered by estradiol (E2) in isogenic MCF-7 breast cancer cells that undergo apoptosis (MCF-7:5C) versus cells that proliferate upon exposure to E2 (MCF-7). The nuclear receptor co-activator AIB1 (Amplified in Breast Cancer-1) is known to be rate-limiting for E2-induced cell survival responses in MCF-7 cells and was found here to also be required for the induction of apoptosis by E2 in the MCF-7:5C cells. Proteins that interact with AIB1 as well as complexes that contain tyrosine phosphorylated proteins were isolated by immunoprecipitation and identified by mass spectrometry (MS) at baseline and after a brief exposure to E2 for two hours. Bioinformatic network analyses of the identified protein interactions were then used to analyze E2 signaling pathways that trigger apoptosis versus survival. Comparison of MS data with a computationally-predicted AIB1 interaction network showed that 26 proteins identified in this study are within this network, and are involved in signal transduction, transcription, cell cycle regulation and protein degradation.
Conclusions: G-protein-coupled receptors, PI3 kinase, Wnt and Notch signaling pathways were most strongly associated with E2-induced proliferation or apoptosis and are integrated here into a global AIB1 signaling network that controls qualitatively distinct responses to estrogen.
Conflict of interest statement
Figures


Similar articles
-
AIB1 sequestration by androgen receptor inhibits estrogen-dependent cyclin D1 expression in breast cancer cells.BMC Cancer. 2019 Nov 4;19(1):1038. doi: 10.1186/s12885-019-6262-4. BMC Cancer. 2019. PMID: 31684907 Free PMC article.
-
The PI3K and AIB1 interaction is involved in estrogen treated breast cancer cells.Cell Mol Biol (Noisy-le-grand). 2018 May 15;64(6):65-70. Cell Mol Biol (Noisy-le-grand). 2018. PMID: 29808803
-
Buthionine sulfoximine sensitizes antihormone-resistant human breast cancer cells to estrogen-induced apoptosis.Breast Cancer Res. 2008;10(6):R104. doi: 10.1186/bcr2208. Epub 2008 Dec 5. Breast Cancer Res. 2008. PMID: 19061505 Free PMC article.
-
Mechanisms underlying differential response to estrogen-induced apoptosis in long-term estrogen-deprived breast cancer cells.Int J Oncol. 2014 May;44(5):1529-38. doi: 10.3892/ijo.2014.2329. Epub 2014 Mar 6. Int J Oncol. 2014. PMID: 24604139 Free PMC article.
-
The nuclear receptor coactivator AIB1 mediates insulin-like growth factor I-induced phenotypic changes in human breast cancer cells.Cancer Res. 2004 Nov 15;64(22):8299-308. doi: 10.1158/0008-5472.CAN-04-0354. Cancer Res. 2004. PMID: 15548698
Cited by
-
Effect of estrogen sulfation by SULT1E1 and PAPSS on the development of estrogen-dependent cancers.Cancer Sci. 2012 Jun;103(6):1000-9. doi: 10.1111/j.1349-7006.2012.02258.x. Epub 2012 Apr 11. Cancer Sci. 2012. PMID: 22380844 Free PMC article.
-
Cyclin D1 expression in colorectal cancer is a favorable prognostic factor in men but not in women in a prospective, population-based cohort study.Biol Sex Differ. 2011 Sep 3;2:10. doi: 10.1186/2042-6410-2-10. Biol Sex Differ. 2011. PMID: 21888663 Free PMC article.
-
Minireview: progress and challenges in proteomics data management, sharing, and integration.Mol Endocrinol. 2012 Oct;26(10):1660-74. doi: 10.1210/me.2012-1180. Epub 2012 Aug 17. Mol Endocrinol. 2012. PMID: 22902541 Free PMC article. Review.
-
Modeling of the growth kinetics of occult breast tumors: role in interpretation of studies of prevention and menopausal hormone therapy.Cancer Epidemiol Biomarkers Prev. 2012 Jul;21(7):1038-48. doi: 10.1158/1055-9965.EPI-12-0043. Epub 2012 May 14. Cancer Epidemiol Biomarkers Prev. 2012. PMID: 22586072 Free PMC article.
-
Molecular mechanism of action of bisphenol and bisphenol A mediated by oestrogen receptor alpha in growth and apoptosis of breast cancer cells.Br J Pharmacol. 2013 May;169(1):167-78. doi: 10.1111/bph.12122. Br J Pharmacol. 2013. PMID: 23373633 Free PMC article.
References
-
- Lippman ME, Bolan G. Oestrogen-responsive human breast cancer in long term tissue culture. Nature. 1975;256:592–593. - PubMed
-
- EBCTCG. Effects of chemotherapy and hormonal therapy for early breast cancer on recurrence and 15-year survival: an overview of the randomised trials. The Lancet. 2005;365:1687–1717. - PubMed
-
- Howell A, Cuzick J, Baum M, Buzdar A, Dowsett M, et al. Results of the ATAC (Arimidex, Tamoxifen, Alone or in Combination) trial after completion of 5 years' adjuvant treatment for breast cancer. Lancet. 2005;365:60–62. - PubMed
-
- Nicholson RI, Johnston SR. Endocrine therapy–current benefits and limitations. Breast Cancer Res Treat. 2005;93(Suppl 1):S3–10. - PubMed
-
- Brauch H, Jordan VC. Targeting of tamoxifen to enhance antitumour action for the treatment and prevention of breast cancer: the ‘personalised’ approach? Eur J Cancer. 2009;45:2274–2283. - PubMed
Publication types
MeSH terms
Substances
Grants and funding
LinkOut - more resources
Full Text Sources
Other Literature Sources
Medical
Miscellaneous
