. 2011;6(6):e20486.
doi: 10.1371/journal.pone.0020486. Epub 2011 Jun 29.

Linking neuronal ensembles by associative synaptic plasticity

Affiliations

Linking neuronal ensembles by associative synaptic plasticity

Qi Yuan et al. PLoS One. 2011.

Abstract

Synchronized activity in ensembles of neurons recruited by excitatory afferents is thought to contribute to the coding information in the brain. However, the mechanisms by which neuronal ensembles are generated and modified are not known. Here we show that in rat hippocampal slices associative synaptic plasticity enables ensembles of neurons to change by incorporating neurons belonging to different ensembles. Associative synaptic plasticity redistributes the composition of different ensembles recruited by distinct inputs such as to specifically increase the similarity between the ensembles. These results show that in the hippocampus, the ensemble of neurons recruited by a given afferent projection is fluid and can be rapidly and persistently modified to specifically include neurons from different ensembles. This linking of ensembles may contribute to the formation of associative memories.


Conflict of interest statement

Competing Interests: The authors have declared that no competing interests exist.

Figures

Figure 1
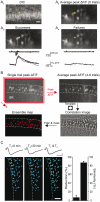
Figure 1. Imaging CA1 pyramidal cell ensembles recruited by stimulation of Schaffer collateral afferent inputs.
A, Calcium transients in Oregon Green-1 loaded CA1 pyramidal cells are action-potential dependent. A1, DIC image of the pyramidal cell layer. The pyramidal cell marked by a yellow asterisk was recorded in the loose patch configuration and SC inputs were evoked via a stimulating electrode in stratum radiatum. Stimulus strength was set at threshold for evoking spikes in the targeted cell. Scale bar, 20 µm. A2, SC stimulation evokes calcium transients revealed by the ΔF/F image averaged across 6 stimulus trials. A3, Average dF/F image of 4 trials in which a calcium transient was detected in the targeted cell (Successes). Traces of individual trials show loose patch recordings of action potentials from the targeted cell (top) and time course of the dF/F signal of the same cell. A4, average dF/F image of 2 trials in which a calcium transient was not evoked (Failures). Traces indicate that the failure to evoke action potentials on single trials (top) did not generate calcium transients in the targeted cell. Calcium transients were always associated with spiking in all cells tested with loose patch recording (n = 6). B, Steps diagramming methods used to construct activity maps of cell ensembles. C, Activity maps of SC-evoked cell ensembles are stable over time. Left, Representative experiment illustrating cell ensembles recruited by SC stimulation at two time points (T1 and T2, 30 minute interval). Activated neurons in the pyramidal cell layer are color-coded blue and field EPSPs recorded in stratum radiatum during each imaging period are shown above. The activity maps and field EPSPs from the two periods are overlaid (T1 + T2, image color code: blue cells are recruited during both imaging periods, white cells are those recruited during T1 but absent during T2, red cells are those recruited during T2 but absent during T1). Scale bar for activity maps, 50 µm. Right, summary (n = 5) of the stability of cell ensembles over a 30 min time period.
Figure 2
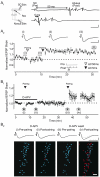
Figure 2. Timing-dependent associative synaptic plasticity enlarges active neural ensembles.
A1 Left, recording configuration. Right, induction protocol for studying timing-dependent plasticity. Example traces show the SC-evoked field EPSP followed 50 ms (top) or 5 ms (bottom) later by alveus stimulation (3 pulses, 100 Hz). A2, Summary plot of timing-dependent LTP of SC fEPSPs induced by paired pre- and postsynaptic activity (n = 5). Single SC-evoked EPSPs (pre) were paired with brief trains of alveus stimulation (post, 3 pulses, 100 Hz) for 30 trials at 0.5 Hz. Pairing of alveus stimuli 50 ms following presynaptic activity (open triangle) had no effect on the fEPSP, while subsequent pairing using a 5 ms delay led to stable LTP. Top, representative fEPSPs recorded at the time points indicated on the summary plot. B, Pairing-induced LTP is NMDAR-dependent and enhances the number of pyramidal cells belonging to the SC ensemble. B1, Pairing SC and alveus stimulation (5 ms delay) in the presence of D-APV (50 µM) has no effect on the fEPSP, while subsequent pairing following drug washout elicits LTP (n = 5). B2, Pairing-induced LTP of fEPSPs is accompanied by an enlargement of the SC ensemble. Activity maps of SC-evoked CA1 cell ensembles from a representative experiment. Images and corresponding fEPSPs were acquired during the periods indicated by cameras in B1. Activated neurons in the pyramidal cell layer are color-coded blue and cells added after pairing are colored red. Scale bar for activity maps, 50 µm. Scale bars for fEPSPs, 0.5 mV and 20 ms.
Figure 3
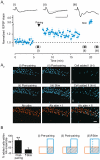
Figure 3. Pairing-induced synaptic plasticity selectively recruits cells from a defined population.
A1, Summary plot showing increases in fEPSPs following pairing-induced LTP and subsequent increase in SC stimulus strength (n = 6). Example fEPSPs (top traces) from one experiment at the indicated time points (scale bars, 0.2 mV, 20 ms). A2, Cell activity maps from one experiment at the indicated time points (cameras, scale = 50 µm). Top row, Images show cells activated by the SC stimulation (blue) before (i) and after (i) pairing along with the new cells recruited (Cells added 1). Middle row, Cells activated following pairing (ii) and after increasing stimulus strength (iii) along with new cells recruited by the stimulus increase (Cells added II). Bottom row, images show cells activated by the alveus stimulation (orange) superimposed with those of the SC ensembles recruited by pairing-induced plasticity (Alv stim + I) and the increase in stimulus strength (Alv stim + II). Cells color-coded white belong to both the SC and alveus ensembles. B, Left, Summary showing that a larger fraction of newly added cells belong to the alveus population following LTP induction compared to those recruited by increased stimulation strength (n = 6; **, p<0.01). Right, diagram illustrating the dynamics of neuronal ensembles in this experiment. Blue and orange outlines represent the neuronal populations activated by SC and alveus stimulation, respectively. Hatched areas indicate cells that belong to both ensembles.
Figure 4
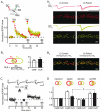
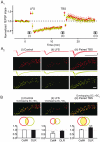
Figure 4. Associative LTP of two independent Schaffer collateral pathways merges the ensembles of pyramidal cells recruited by the two pathways.
A1, Summary plot of fEPSPs showing associative LTP induced by simultaneous (paired) theta burst stimulation (TBS) of two SC pathways, while prior independent (unpaired) TBS does not cause potentiation (n = 4). Inset, recording configuration. A2, fEPSPs and cell ensembles evoked by each pathway (red, green) in one experiment at the times indicated on the summary plot. Scale bar, 0.2 mV and 20 ms. B, Associative LTP significantly increases the overlap ratio (OLR) of the two SC ensembles. B1, OLR was measured as the cells common between the two ensembles (SC1+2) divided by the total cells in the two ensembles (SC1 + SC2 - SC1+2, we subtract SC1+2 in order not to count cells common to both ensembles twice). Summary data plot the increase in total cells (SC1 +SC2) and OLR of the two ensembles normalized to control conditions (n = 4 slices; **, p<0.01). B2, Overlay of the two SC-evoked neuronal ensembles (red, green) shown in (A2). Yellow cells indicate neurons common to the two ensembles. (C,D) Increasing afferent input by increasing stimulus strength expands the size of cell ensembles but associative LTP causes a greater increase in overlap between two SC ensembles. C, Associative LTP was induced by pairing a weak stimulus (one TBS, black arrow) in one pathway (black traces) with a strong stimulus (four TBS, gray arrow) to the other pathway (not shown). Cell ensembles were measured under control conditions (i), following an increase in stimulus strength (ii), when stimulus strength was returned back to control (iii) and following associative LTP (iv). D, Summary data showing change in total number of cells and OLR relative to control conditions for changes in stimulus strength and associative LTP (n = 3; *, p<0.05).
Figure 5
Figure 5. Bidirectional synaptic plasticity can merge neuronal ensembles without altering ensemble size.
A1, Summary plot of fEPSPs showing that low frequency stimulation (LFS, 300 pulses, 1 Hz) of two SC pathways (red, green) induces LTD and subsequent paired TBS induces LTP that returns the fEPSP to control conditions. A2, Images and traces from one experiment collected at the time points indicated on the summary plot. LTD and LTP of fEPSPs were accompanied, respectively, by a reduction and a restoration of the size of neuronal ensembles recruited by the two SC pathways. Red and green represent the neuronal ensembles recruited by two independent SC pathways. Scale bars, 0.5 mV, 20 ms. B, Comparison of change in total number of cells and overlap between the two neuronal ensembles following LFS and subsequent paired TBS normalized to control conditions (n = 8; **, P<0.01). Schematics show the redistribution of the neuronal ensembles.

References

    1. Averbeck BB, Latham PE, Pouget A. Neural correlations, population coding and computation. Nat Rev Neurosci. 2006;7:358–366. - PubMed
    1. Usrey WM, Reid RC. Synchronous activity in the visual system. Annu Rev Physiol. 1999;61:435–456. - PubMed
    1. Ohki K, Chung S, Ch'ng YH, Kara P, Reid RC. Functional imaging with cellular resolution reveals precise micro-architecture in visual cortex. Nature. 2005;433:597–603. - PubMed
    1. Wilson MA, McNaughton BL. Dynamics of the hippocampal ensemble code for space. Science. 1993;261:1055–1058. - PubMed
    1. Leutgeb S, Leutgeb JK, Moser MB, Moser EI. Place cells, spatial maps and the population code for memory. Curr Opin Neurobiol. 2005;15:738–746. - PubMed

Publication types