. 2011;6(6):e21657.
doi: 10.1371/journal.pone.0021657. Epub 2011 Jun 28.

High DNA methylation pattern intratumoral diversity implies weak selection in many human colorectal cancers

Affiliations

High DNA methylation pattern intratumoral diversity implies weak selection in many human colorectal cancers

Kimberly D Siegmund et al. PLoS One. 2011.

Abstract

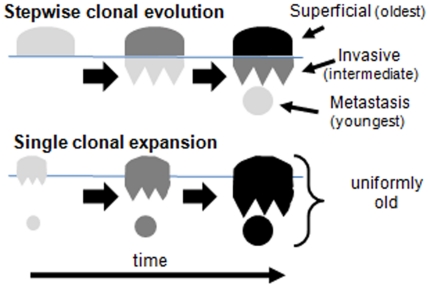
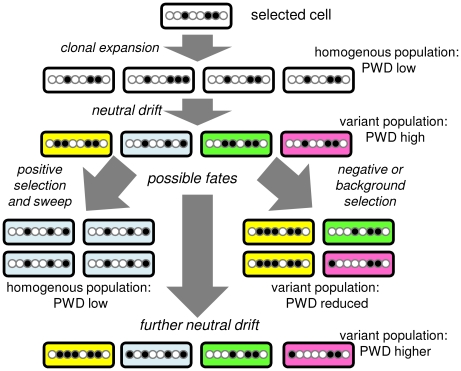
Background: It is possible to infer the past of populations by comparing genomes between individuals. In general, older populations have more genomic diversity than younger populations. The force of selection can also be inferred from population diversity. If selection is strong and frequently eliminates less fit variants, diversity will be limited because new, initially homogeneous populations constantly emerge.

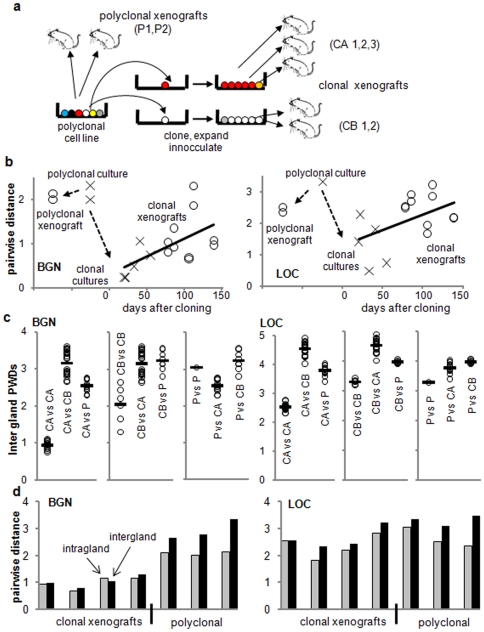
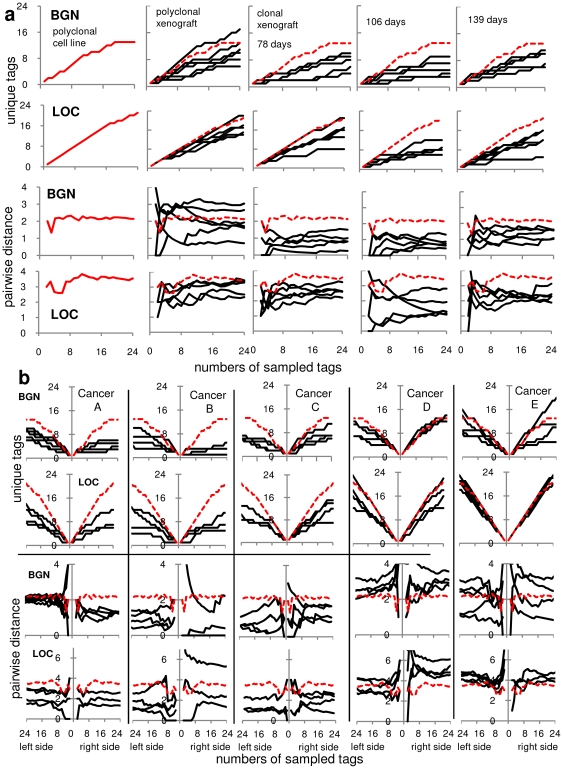
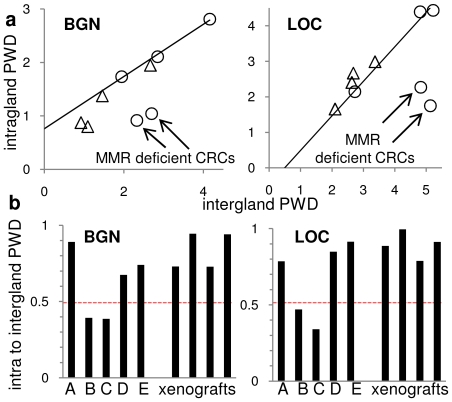
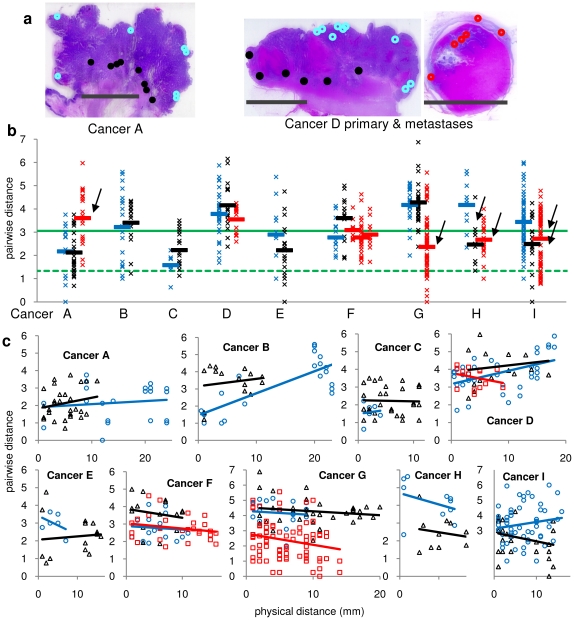
Methodology and results: Here we translate a population genetics approach to human somatic cancer cell populations by measuring genomic diversity within and between small colorectal cancer (CRC) glands. Control tissue culture and xenograft experiments demonstrate that the population diversity of certain passenger DNA methylation patterns is reduced after cloning but subsequently increases with time. When measured in CRC gland populations, passenger methylation diversity from different parts of nine CRCs was relatively high and uniform, consistent with older, stable lineages rather than mixtures of younger homogeneous populations arising from frequent cycles of selection. The diversity of six metastases was also high, suggesting dissemination early after transformation. Diversity was lower in DNA mismatch repair deficient CRC glands, possibly suggesting more selection and the elimination of less fit variants when mutation rates are elevated.

Conclusion/significance: The many hitchhiking passenger variants observed in primary and metastatic CRC cell populations are consistent with relatively old populations, suggesting that clonal evolution leading to selective sweeps may be rare after transformation. Selection in human cancers appears to be a weaker than presumed force after transformation, consistent with the observed rarity of driver mutations in cancer genomes. Phenotypic plasticity rather than the stepwise acquisition of new driver mutations may better account for the many different phenotypes within human tumors.


Conflict of interest statement

Competing Interests: The authors have declared that no competing interests exist.

Figures

Figure 1
Figure 1. Two progression models.
Stepwise selection and clonal evolution creates populations of different diversities and phenotypes because they are created at different times from different progenitors after transformation. By contrast, the diversity of a single clonal expansion is relatively uniform.
Figure 2
Figure 2. Hitchhiking neutral or passenger methylation.
A male cancer cell contains a single methylation pattern on a CpG rich region of the X-chromosome. The passenger methylation pattern will drift and hitchhike with the fate of its cell. After clonal expansion, the cancer cell population will be initially homogeneous but variant cells (different colors) and passenger methylation patterns will arise from drift (replication errors). A diverse population has three fates. If no selection occurs, a population will continue to drift and become more diverse. Strong positive selection of a variant (blue) cell results in a sweep or clonal evolution, with homogenization of the population and hitchhiking passenger methylation. Weak negative or background selection leads to loss of a variant cell (blue) and a reduction in the diversity of the hitchhiking methylation patterns. Therefore, the strength of selection can be inferred by measuring the PWDs of hitchhiking passenger methylation patterns within a population.
Figure 3
Figure 3. Experimental clonal evolution.
A. Schematic of the Lovo single cell cloning, first in culture and then as xenografts, simulating a clonal evolution bottleneck. B. Hitchhiking diversity decreases and then increases in culture and the xenografts after single cell cloning. (X's represent independent single cell clones in culture, and O's represent PWD averages among tags isolated from 5 to 6 small xenograft fragments) The LOC tag has a higher error rate compared to the BGN tag , and more quickly restores the diversity seen in polyclonal populations. C. Comparisons between fragments demonstrate intergland PWDs are smaller between clonally related tumors and larger between unrelated tumors, indicating the ability of the LOC or BGN tags to identify and distinguish between new and older clonal expansions (circles are averages of the fragment comparisons between the different xenografts, and bars are overall averages) D. Xenograft intragland PWDs are typically nearly as large as their intergland PWDs, indicating that the small tumor fragments are almost as diverse as their tumors.
Figure 4
Figure 4. Deeper sampling.
A. More unique epiallele patterns are observed within polyclonal cultures and the small xenograft fragments when sampling is increased to 24 tags. PWD values are relatively stable after 8 sampled tags (for reference, the dotted red lines are the polyclonal cell line values). B. Deeper sampling of glands from five human CRCs. The three cancers on the left are relatively younger cancers with diversity similar to the clonal xenografts. The two cancers on the right are relatively older cancers with diversity similar to the polyclonal cell line or xenografts. Consistent with a single clonal expansion, diversity is similar between right and left parts of the same CRC.
Figure 5
Figure 5. Intragland versus intergland PWDs.
A. Intra- and intergland PWDs generally correlate. The trend line is based on three human CRCs, with the two MMR deficient cancers with much lower intragland PWDs. (circles are human CRCs, triangles are the clonal and polyclonal xenografts). B. Ratios of intra- to intergland PWDs were greater than 0.5 except for the MMR deficient CRCs, indicating much greater extinction within glands of the MMR deficient CRCs.
Figure 6
Figure 6. Diversity in human invasive and metastatic CRCs.
A. Diagram of the LCM sampling of Cancers A and D. Dots are locations of the superficial (blue), invasive (black), and metastatic (red) regions. (bar is 1 cm wide). B. Comparison of intergland PWDs in the superficial (blue), invasive (black) and metastatic (red) regions of the nine CRCs. PWDs between individual LCM samples (“X”) are scattered, with averages represented by the bars. The scatter of the PWDs between individual glands is expected because of the stochastic nature of replication errors, and regions within the same tumor that were significantly different (arrows) from their superficial regions were identified from simulations (see Methods). For reference, the intergland PWDs of the clonal (dotted green line) and polyclonal xenografts (solid green line) are illustrated. C. Comparisons of intergland PWDs with physical distances indicate that distant and adjacent glands are similarly related in the superficial (blue), invasive (black) and metastatic (red) regions. A significant increase in PWDs with physical distance (p<0.05) was observed only for the superficial regions of Cancer B and D.

References

    1. Nowell PC. The clonal evolution of tumor cell populations. Science. 1976;194:23–28. - PubMed
    1. Jones S, Chen WD, Parmigiani G, Diehl F, Beerenwinkel N, et al. Comparative lesion sequencing provides insights into tumor evolution. Proc Natl Acad Sci USA. 2008;105:4283–4288. - PMC - PubMed
    1. Bernards R, Weinberg RA. A progression puzzle. Nature. 2002;418:823. - PubMed
    1. Marusyk A, Polyak K. Tumor heterogeneity: causes and consequences. Biochim Biophys Acta. 2010;1805:105–117. - PMC - PubMed
    1. Quintana E, Shackleton M, Foster HR, Fullen DR, Sabel MS, et al. Phenotypic heterogeneity among tumorigenic melanoma cells from patients that is reversible and not hierarchically organized. Cancer Cell. 2010;18:510–523. - PMC - PubMed

Publication types