. 2011;17(11-12):1146-56.
doi: 10.2119/molmed.2011.00169. Epub 2011 Jul 5.

The influence of developmental age on the early transcriptomic response of children with septic shock

Affiliations

The influence of developmental age on the early transcriptomic response of children with septic shock

James L Wynn et al. Mol Med. 2011.

Abstract

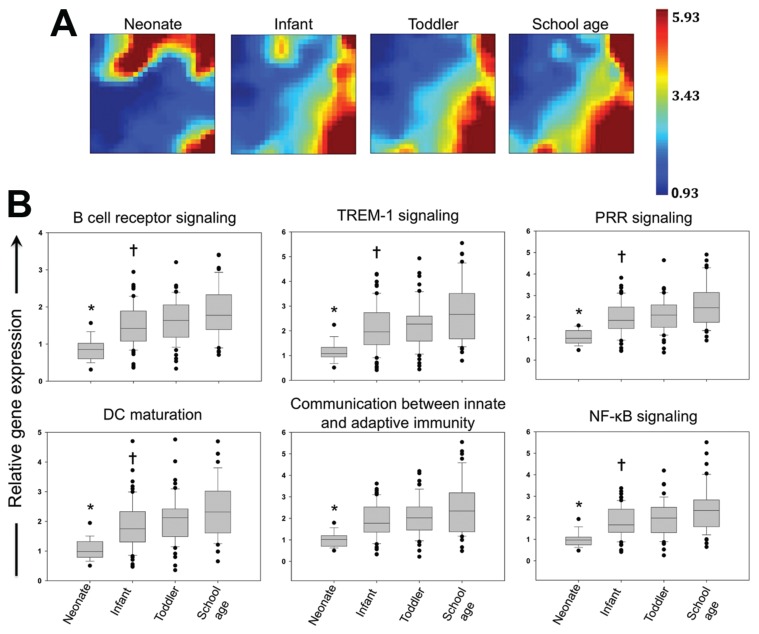
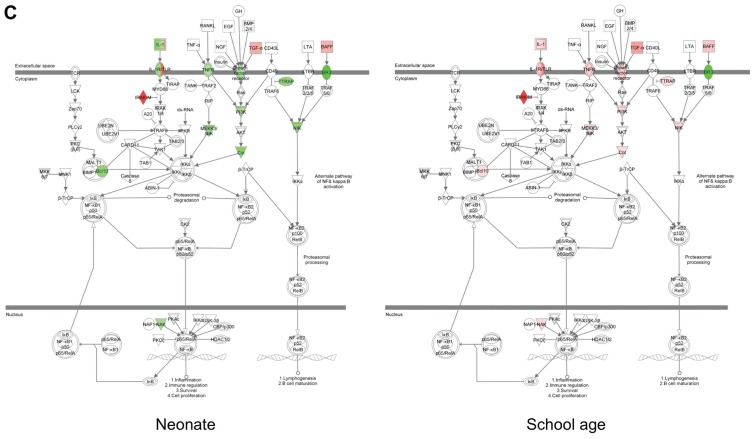
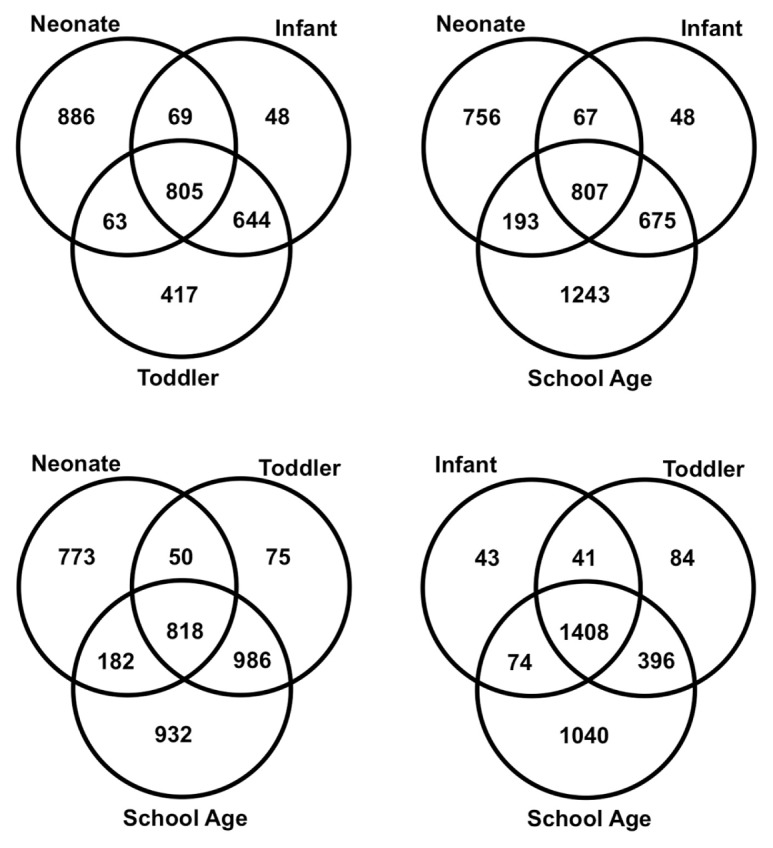
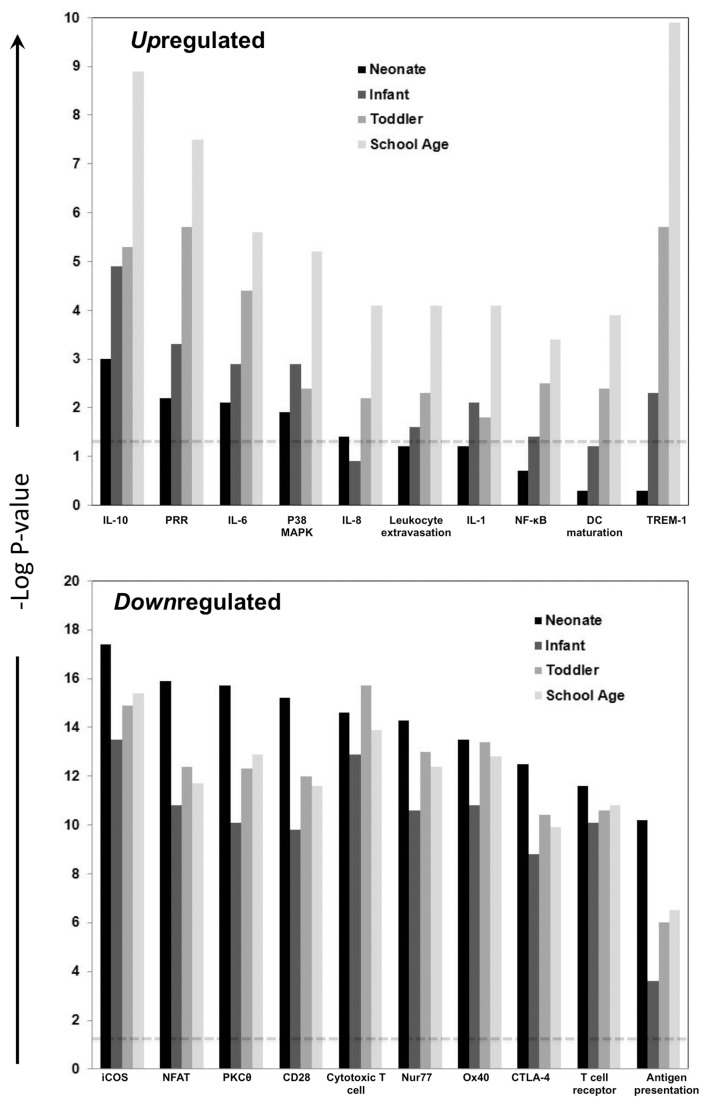
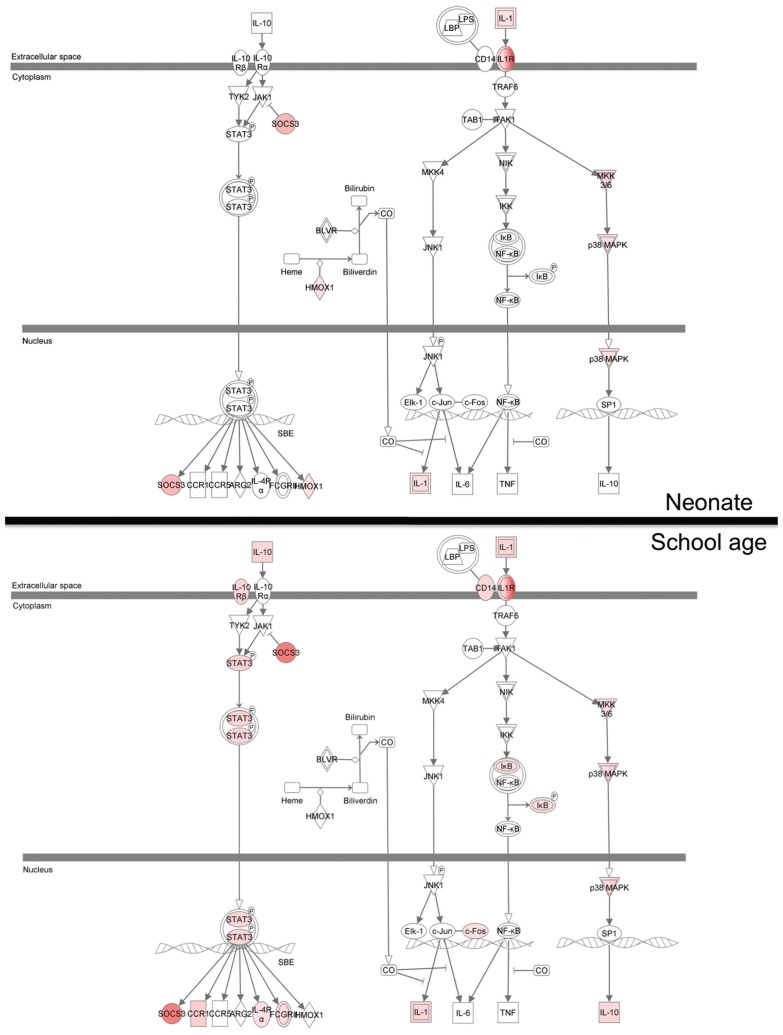
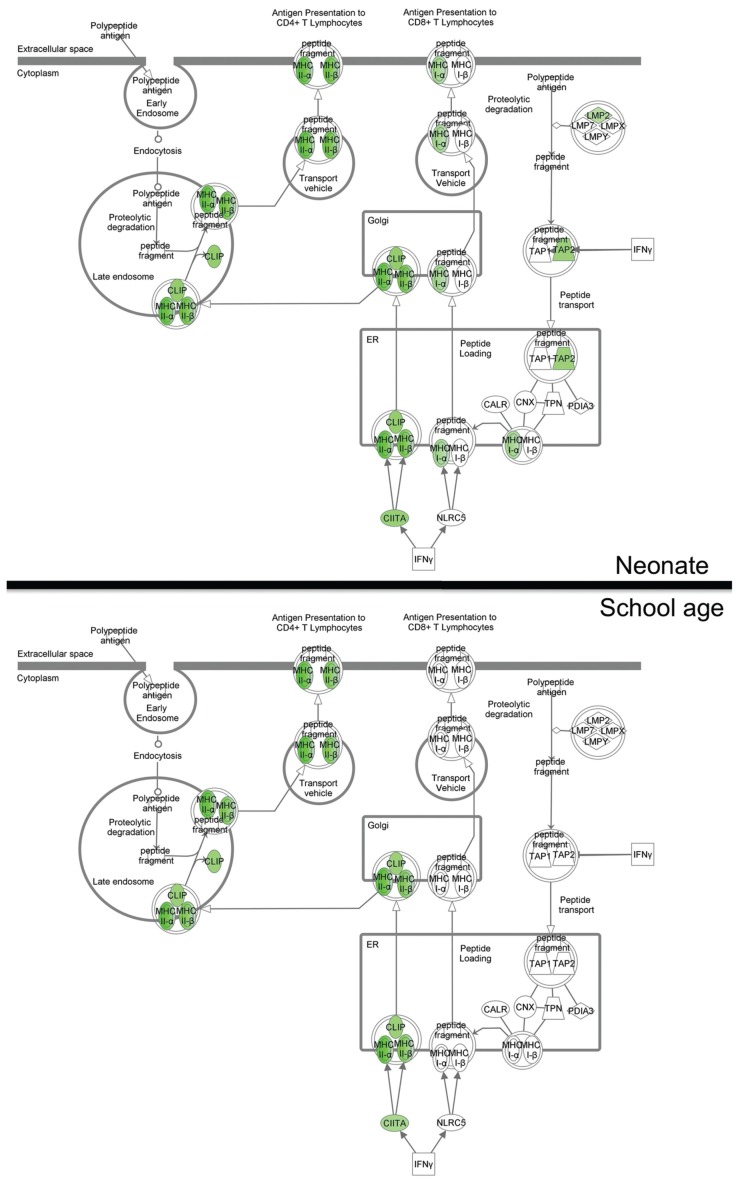
Septic shock is a frequent and costly problem among patients in the pediatric intensive care unit (PICU) and is associated with high mortality and devastating survivor morbidity. Genome-wide expression patterns can provide molecular granularity of the host response and offer insight into why large variations in outcomes exist. We derived whole-blood genome-wide expression patterns within 24 h of PICU admission from children with septic shock. We compared the transcriptome between septic shock developmental-age groups defined as neonates (≤ 28 d, n = 17), infants (1 month to 1 year, n = 62), toddlers (2-5 years, n = 54) and school-age (≥ 6 years, n = 47) and age-matched controls. Direct intergroup comparisons demonstrated profound changes in neonates, relative to older children. Neonates with septic shock demonstrated reduced expression of genes representing key pathways of innate and adaptive immunity. In contrast to the largely upregulated transcriptome in all other groups, neonates exhibited a predominantly downregulated transcriptome when compared with controls. Neonates and school-age subjects had the most uniquely regulated genes relative to controls. Age-specific studies of the host response are necessary to identify developmentally relevant translational opportunities that may lead to improved sepsis outcomes.


Figures

Figure 1
Figure 1
(A) GEDI-generated gene expression mosaics for each of the developmental-age groups. Each mosaic represents the average expression pattern of the same 1,638 gene probes from patients with septic shock in each of the four developmental-age groups. The degree of red intensity correlates with increased gene expression and the degree of blue intensity correlates with decreased gene expression. (B) Relative expression of genes corresponding to the indicated signaling pathways among patients with septic shock from each developmental-age group. Data are expressed as medians with interquartile ranges and were analyzed using ANOVA on ranks. *P < 0.05 versus infant, toddler and school-age groups. P < 0.05 versus school-age group. (C) Relative expression of genes corresponding to the NF-κB pathway in neonates and school-age children with septic shock. An illustrative example of expression data is shown in B. Greater intensity of the gene node coloring represents greater change in expression (green: downregulated; red: upregulated).
Figure 1
Figure 1
(A) GEDI-generated gene expression mosaics for each of the developmental-age groups. Each mosaic represents the average expression pattern of the same 1,638 gene probes from patients with septic shock in each of the four developmental-age groups. The degree of red intensity correlates with increased gene expression and the degree of blue intensity correlates with decreased gene expression. (B) Relative expression of genes corresponding to the indicated signaling pathways among patients with septic shock from each developmental-age group. Data are expressed as medians with interquartile ranges and were analyzed using ANOVA on ranks. *P < 0.05 versus infant, toddler and school-age groups. P < 0.05 versus school-age group. (C) Relative expression of genes corresponding to the NF-κB pathway in neonates and school-age children with septic shock. An illustrative example of expression data is shown in B. Greater intensity of the gene node coloring represents greater change in expression (green: downregulated; red: upregulated).
Figure 2
Figure 2
Total differentially regulated genes between patients with septic shock in each developmental-age category and age-matched controls from across all possible group comparisons. Venn diagrams represent differential gene expression between age-matched controls and patients with septic shock from each of the respective developmental-age groups.
Figure 3
Figure 3
Top signaling pathways represented by the differentially regulated (upregulated and downregulated) genes between patients with septic shock in each developmental-age category versus age-matched controls. The y-axis is depicted as the −log(P value) and provides an indication of how likely a gene list is enriched for a given pathway by chance alone. The −log for a P value of 0.05 is ~1.3 and is indicated by the horizontal dashed line. In contrast, the −log for a P value of 1.0×10⁻⁸ is ~10. The level of significance for a given pathway is directly proportional to the number of genes in a given gene list that correspond to the pathway and indirectly proportional to the total number of genes in the list. PRR, pattern recognition receptor; MAPK, mitogen-activated protein kinase; iCOS, inducible costimulator; NFAT, nuclear factor of activated T cells; PKCθ, protein kinase C theta; Nur77, NR4A nuclear receptor family member Nur77; CTLA-4, cytotoxic T lymphocyte antigen-4.
Figure 4
Figure 4
Differential regulation of genes in the IL-10 pathway in neonates and school-age children with septic shock versus age-matched controls. An illustrative example of the upregulated pathway shown in Figure 3 is demonstrated. The greater intensity of red color represents a greater degree of upregulation in gene expression.
Figure 5
Figure 5
Differential regulation of genes in the antigen presentation pathway in neonates and school-age children with septic shock versus age-matched controls. An illustrative example of the downregulated pathway shown in Figure 3 is demonstrated. Greater intensity of green color represents greater degree of downregulation in gene expression.

References

    1. Watson RS, Carcillo JA. Scope and epidemiology of pediatric sepsis. Pediatr Crit Care Med. 2005;6:S3–5. - PubMed
    1. Mathews TJ, MacDorman MF. Infant mortality statistics from the 2005 period linked birth/infant death data set. Natl Vital Stat Rep. 2008;57:1–32. - PubMed
    1. Lawn JE, Cousens S, Zupan J. 4 million neonatal deaths: when? where? why? Lancet. 2005;365:891–900. - PubMed
    1. Checchia PA, et al. Myocardial transcriptional profiles in a murine model of sepsis: evidence for the importance of age. Pediatr Crit Care Med. 2008;9:530–5. - PubMed
    1. Wynn J, Cornell TT, Wong HR, Shanley TP, Wheeler DS. The host response to sepsis and developmental impact. Pediatrics. 2010;125:1031–41. - PMC - PubMed

Publication types

MeSH terms