

Post-transcriptional regulation of mu-opioid receptor: role of the RNA-binding proteins heterogeneous nuclear ribonucleoprotein H1 and F
- PMID: 21739230
- PMCID: PMC3675771
- DOI: 10.1007/s00018-011-0761-z
Post-transcriptional regulation of mu-opioid receptor: role of the RNA-binding proteins heterogeneous nuclear ribonucleoprotein H1 and F
Abstract
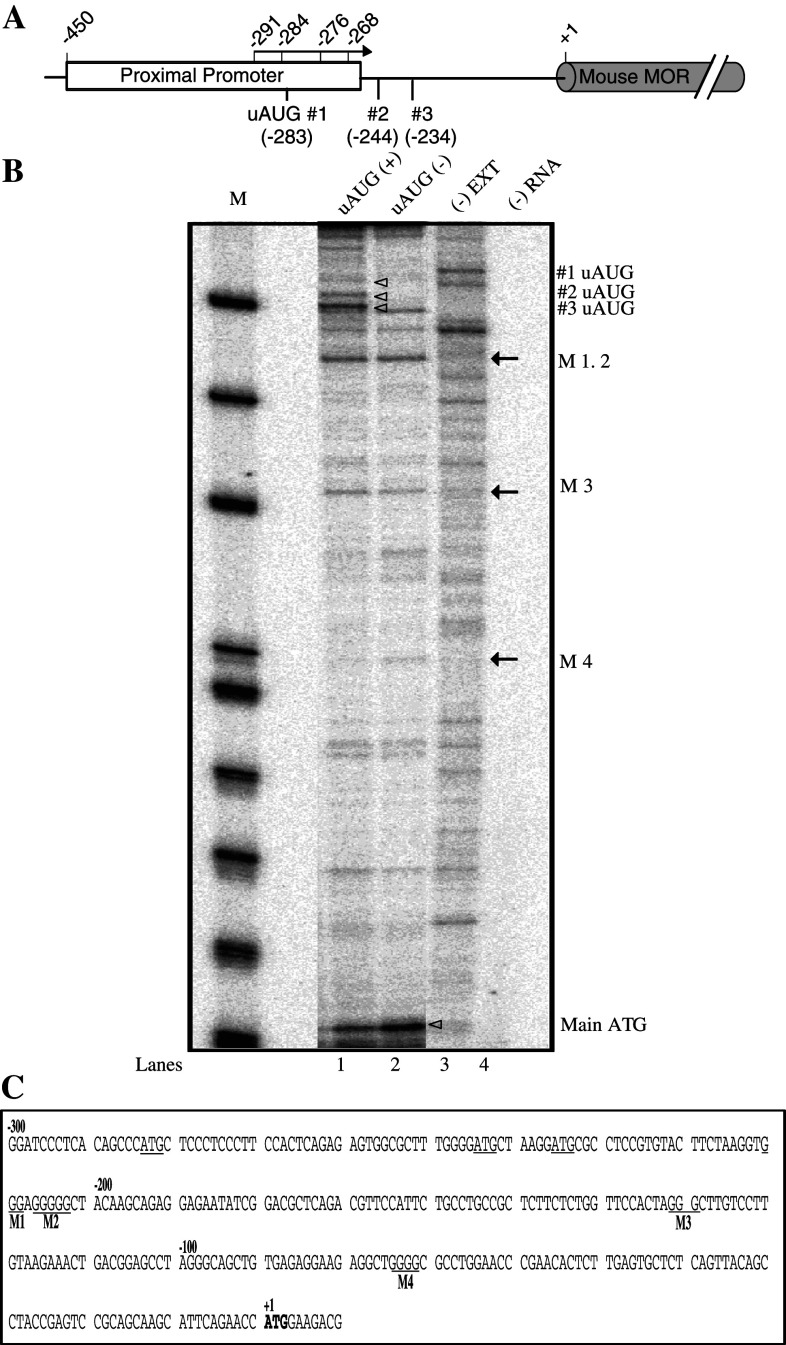
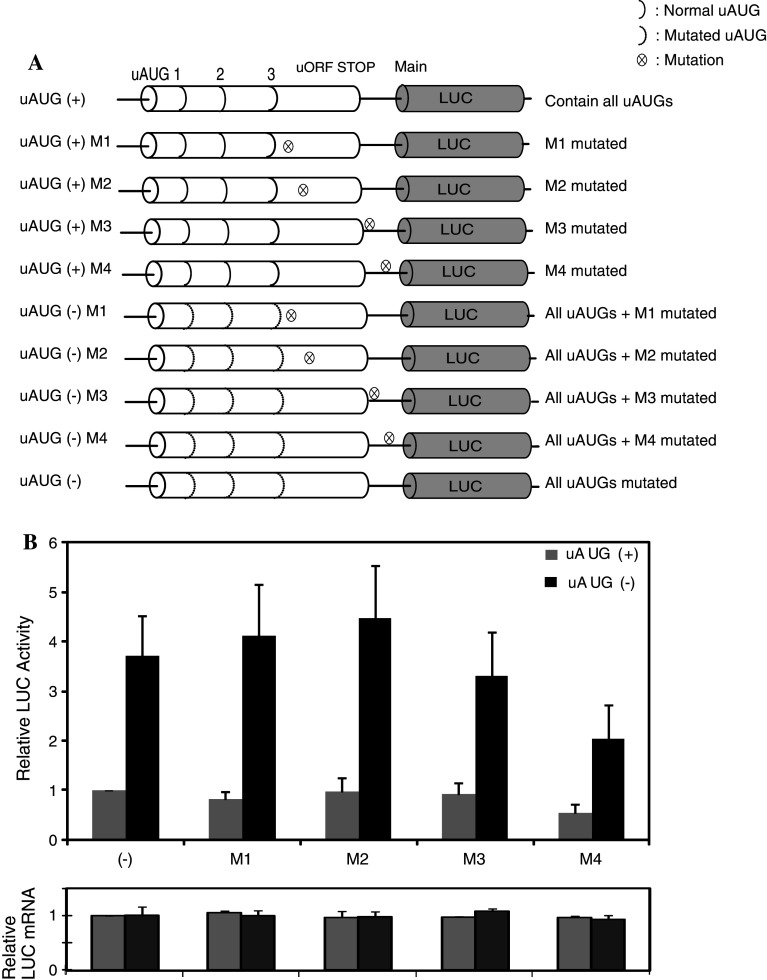
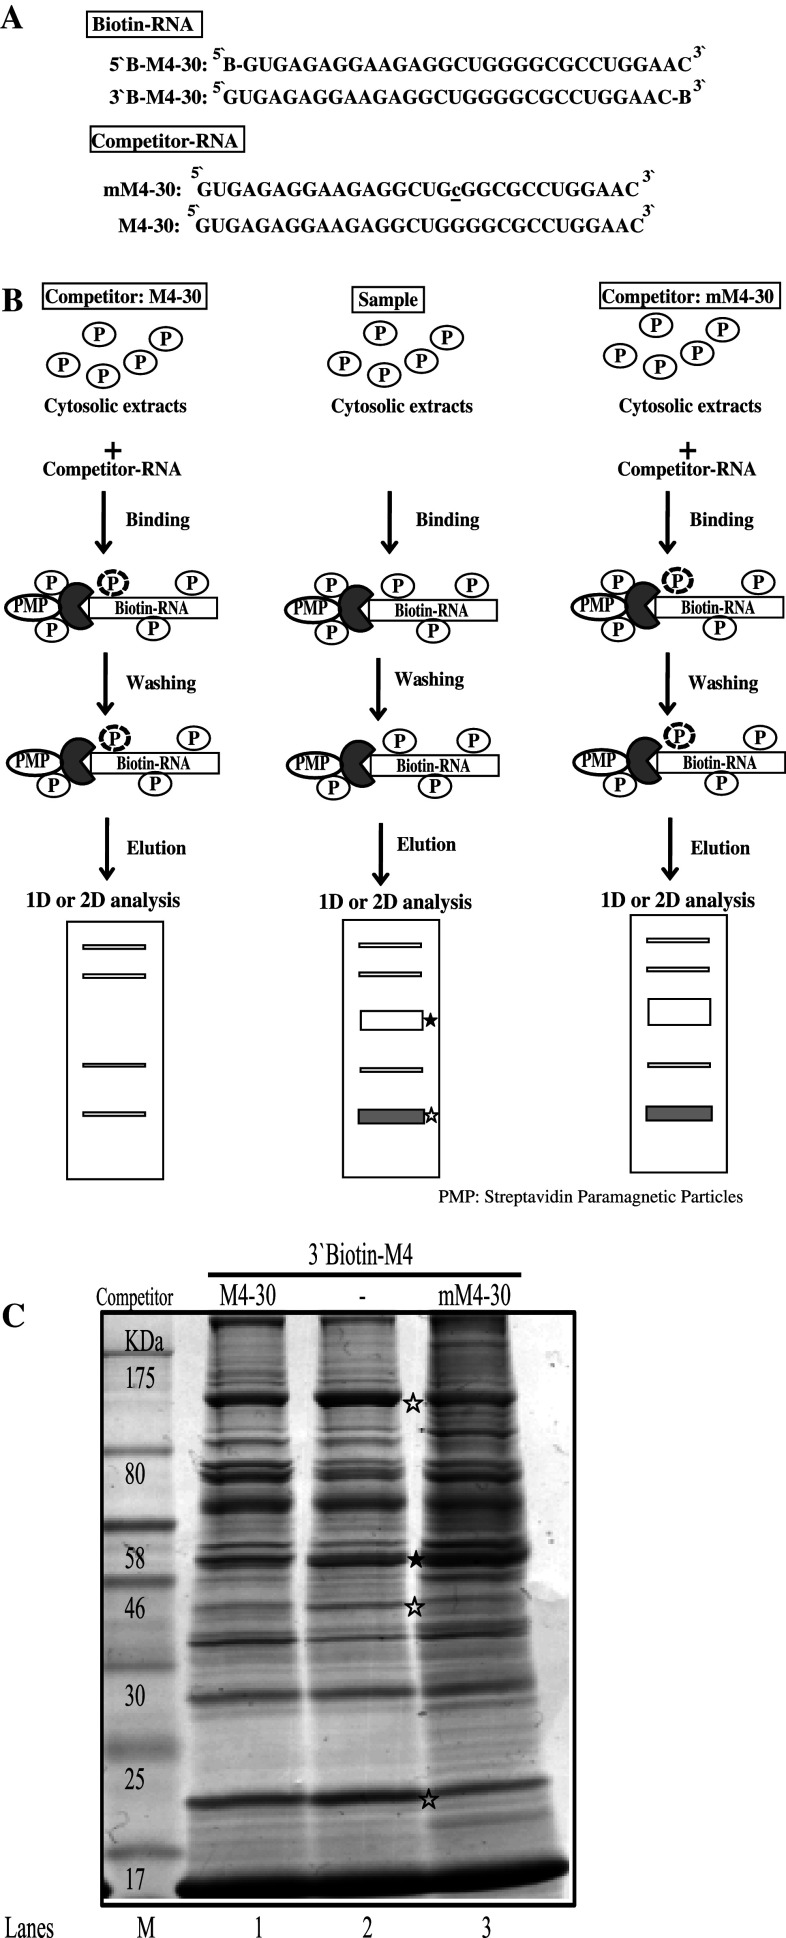
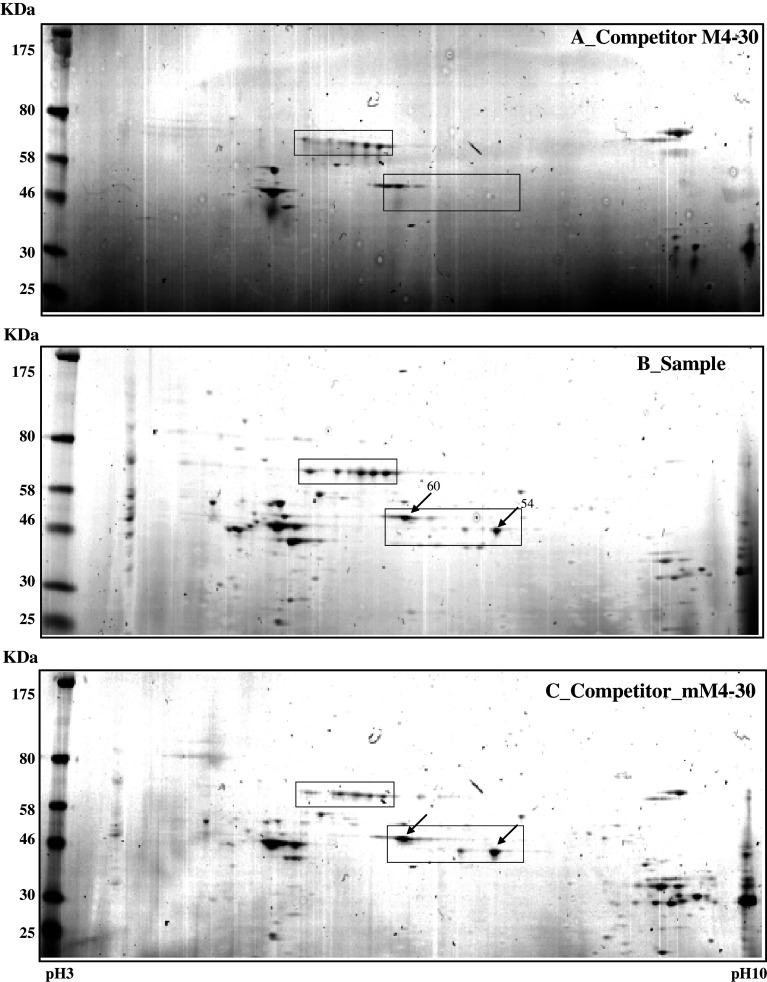
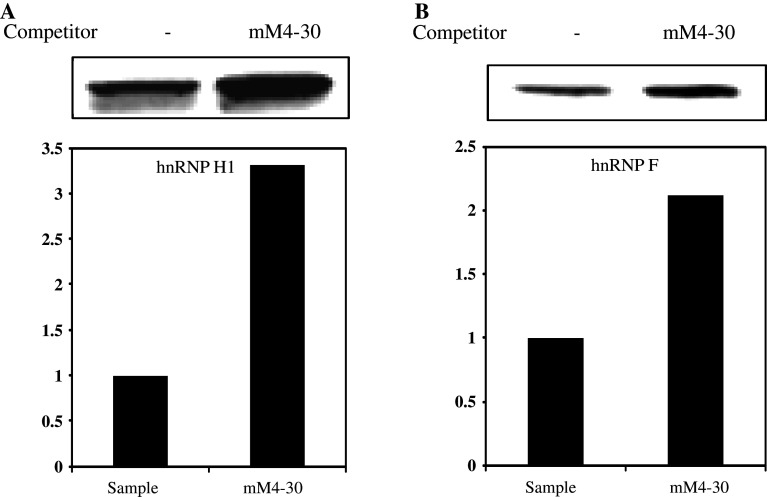
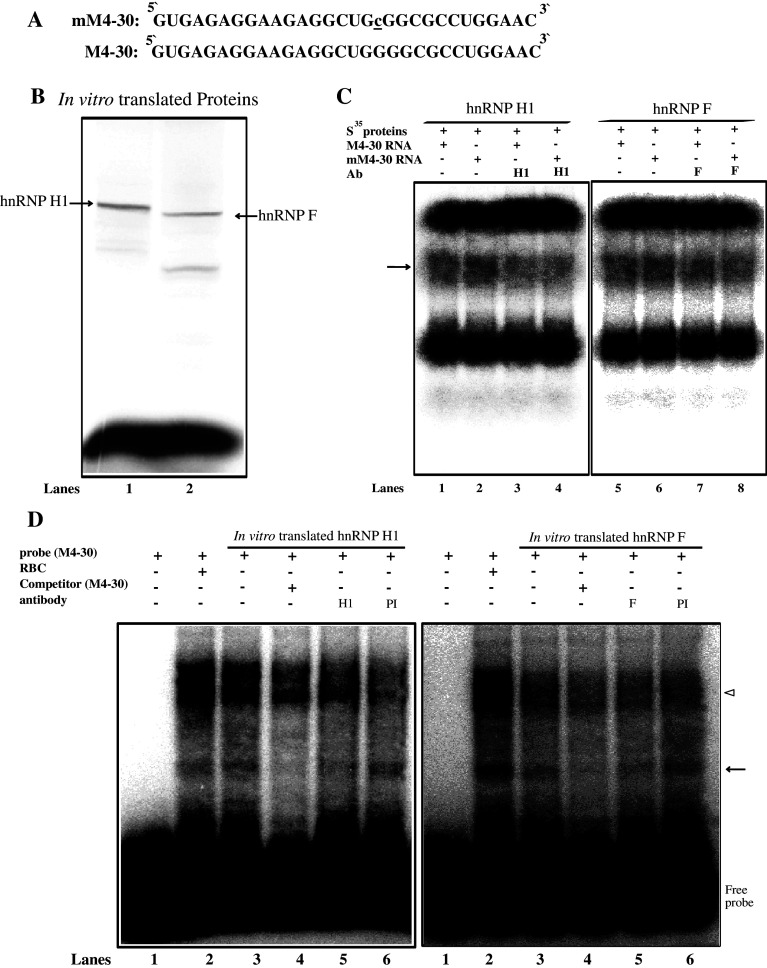
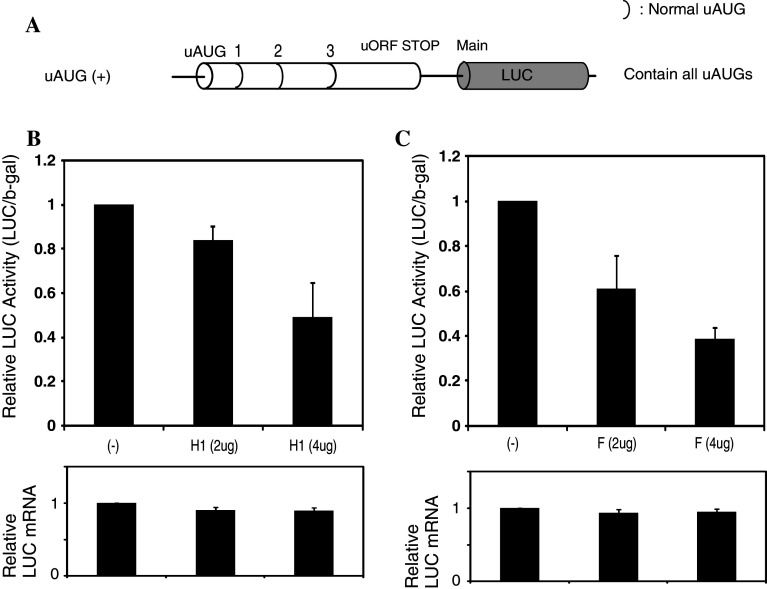
Classical opioids have been historically used for the treatment of pain and are among the most widely used drugs for both acute severe pain and long-term pain. Morphine and endogenous mu-opioid peptides exert their pharmacological actions mainly through the mu-opioid receptor (MOR). However, the expression of opioid receptor (OR) proteins is controlled by extensive transcriptional and post-transcriptional processing. Previously, the 5'-untranslated region (UTR) of the mouse MOR was found to be important for post-transcriptional regulation of the MOR gene in neuronal cells. To identify proteins binding to the 5'-UTR as potential regulators of the mouse MOR gene, affinity column chromatography using 5'-UTR-specific RNA oligonucleotides was performed using neuroblastoma NS20Y cells. Chromatography was followed by two-dimensional gel electrophoresis and MALDI-TOF mass spectrometry. We identified two heterogeneous ribonucleoproteins (hnRNPs) that bound to RNA sequences of interest: hnRNP H1 and hnRNP F. Binding of these proteins to the RNA region was M4-region sequence-specific as confirmed by Western-blot analysis and RNA supershift assay. Furthermore, a cotransfection study showed that the presence of hnRNP H1 and F resulted in repressed expression of the mouse MOR. Our data suggest that hnRNP H1 and F can function as repressors of MOR translation dependent on the M4 (-75 to -71 bp upstream of ATG) sequences. We demonstrate for the first time a role of hnRNPs as post-transcriptional repressors in MOR gene regulation.
Conflict of interest statement
The authors declare no conflicts of interest.
Figures
Similar articles
-
Vimentin interacts with the 5'-untranslated region of mouse mu opioid receptor (MOR) and is required for post-transcriptional regulation.RNA Biol. 2013 Feb;10(2):256-66. doi: 10.4161/rna.23022. Epub 2013 Jan 25. RNA Biol. 2013. PMID: 23353576 Free PMC article.
-
Post-Transcriptional Regulation of the Human Mu-Opioid Receptor (MOR) by Morphine-Induced RNA Binding Proteins hnRNP K and PCBP1.J Cell Physiol. 2017 Mar;232(3):576-584. doi: 10.1002/jcp.25455. Epub 2016 Jun 24. J Cell Physiol. 2017. PMID: 27292014 Free PMC article.
-
Transcriptional regulation of mouse mu opioid receptor gene in neuronal cells by poly(ADP-ribose) polymerase-1.J Cell Mol Med. 2008 Dec;12(6A):2319-33. doi: 10.1111/j.1582-4934.2008.00259.x. Epub 2008 Feb 4. J Cell Mol Med. 2008. PMID: 18266974 Free PMC article.
-
Heterogeneous nuclear ribonucleoprotein A1 in health and neurodegenerative disease: from structural insights to post-transcriptional regulatory roles.Mol Cell Neurosci. 2013 Sep;56:436-46. doi: 10.1016/j.mcn.2012.12.002. Epub 2012 Dec 14. Mol Cell Neurosci. 2013. PMID: 23247072 Review.
-
Epigenetics of µ-opioid receptors: intersection with HIV-1 infection of the central nervous system.J Cell Physiol. 2012 Jul;227(7):2832-41. doi: 10.1002/jcp.24004. J Cell Physiol. 2012. PMID: 22034138 Free PMC article. Review.
Cited by
-
RNA-binding proteins as targets for pain therapeutics.Neurobiol Pain. 2018 Aug-Dec;4:2-7. doi: 10.1016/j.ynpai.2018.01.003. Epub 2018 Jan 31. Neurobiol Pain. 2018. PMID: 30370343 Free PMC article.
-
By up-regulating μ- and δ-opioid receptors, neuron-restrictive silencer factor knockdown promotes neurological recovery after ischemia.Oncotarget. 2017 May 23;8(60):101012-101025. doi: 10.18632/oncotarget.18195. eCollection 2017 Nov 24. Oncotarget. 2017. PMID: 29254142 Free PMC article.
-
The potential consequences of bidirectional promoter methylation on GLA and HNRNPH2 expression in Fabry disease phenotypes in a family of patients carrying a GLA deletion variant.Biomed Rep. 2022 Jun 24;17(2):71. doi: 10.3892/br.2022.1554. eCollection 2022 Aug. Biomed Rep. 2022. PMID: 35910704 Free PMC article.
-
Vimentin interacts with the 5'-untranslated region of mouse mu opioid receptor (MOR) and is required for post-transcriptional regulation.RNA Biol. 2013 Feb;10(2):256-66. doi: 10.4161/rna.23022. Epub 2013 Jan 25. RNA Biol. 2013. PMID: 23353576 Free PMC article.
-
Heterogeneous nuclear ribonucleoprotein (hnRNP) F is a novel component of oligodendroglial RNA transport granules contributing to regulation of myelin basic protein (MBP) synthesis.J Biol Chem. 2012 Jan 13;287(3):1742-54. doi: 10.1074/jbc.M111.235010. Epub 2011 Nov 29. J Biol Chem. 2012. PMID: 22128153 Free PMC article.
References
Publication types
MeSH terms
Substances
Grants and funding
- R01 DA000564/DA/NIDA NIH HHS/United States
- P50 DA011806/DA/NIDA NIH HHS/United States
- R56 DA000564/DA/NIDA NIH HHS/United States
- DA011190/DA/NIDA NIH HHS/United States
- K02 DA013926/DA/NIDA NIH HHS/United States
- K05 DA070554/DA/NIDA NIH HHS/United States
- DA001583/DA/NIDA NIH HHS/United States
- DA011806/DA/NIDA NIH HHS/United States
- DA000564/DA/NIDA NIH HHS/United States
- R01 DA001583/DA/NIDA NIH HHS/United States
- DA013926/DA/NIDA NIH HHS/United States
- R01 DA011190/DA/NIDA NIH HHS/United States
- K05-DA070554/DA/NIDA NIH HHS/United States
LinkOut - more resources
Full Text Sources
Research Materials
