

Extent of enthalpy-entropy compensation in protein-ligand interactions
- PMID: 21739503
- PMCID: PMC3190155
- DOI: 10.1002/pro.692
Extent of enthalpy-entropy compensation in protein-ligand interactions
Abstract
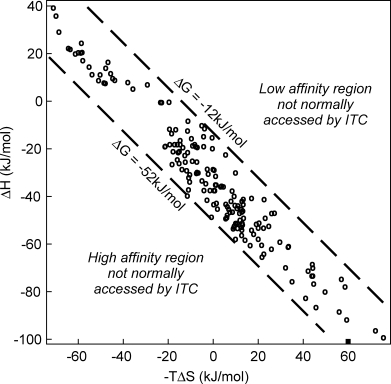
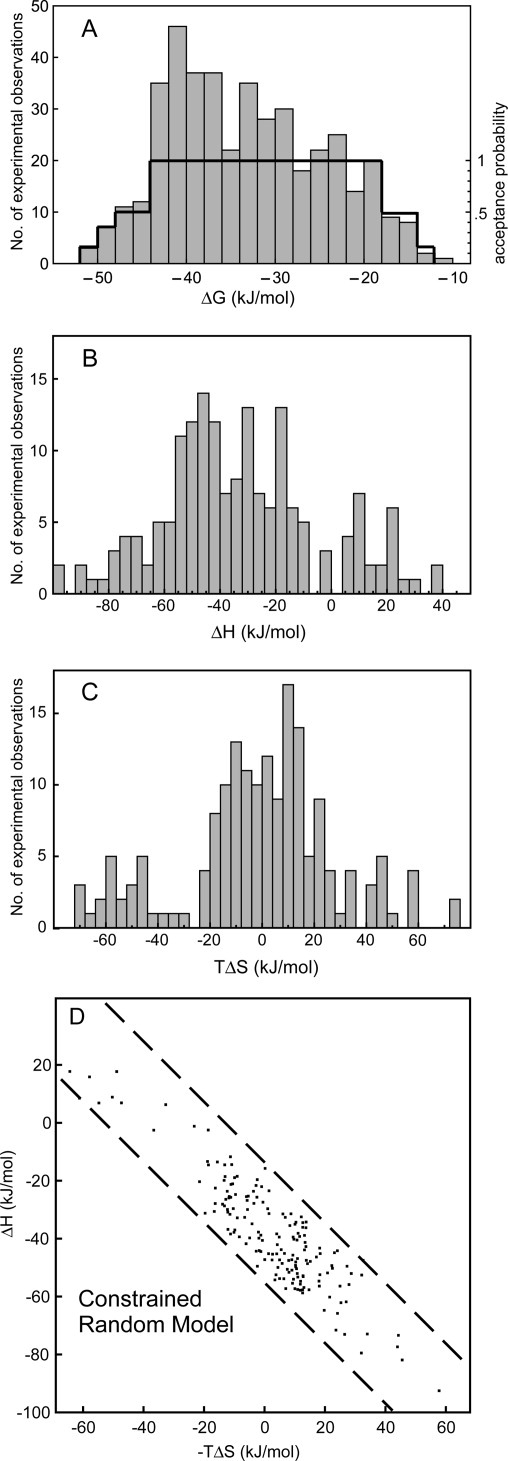
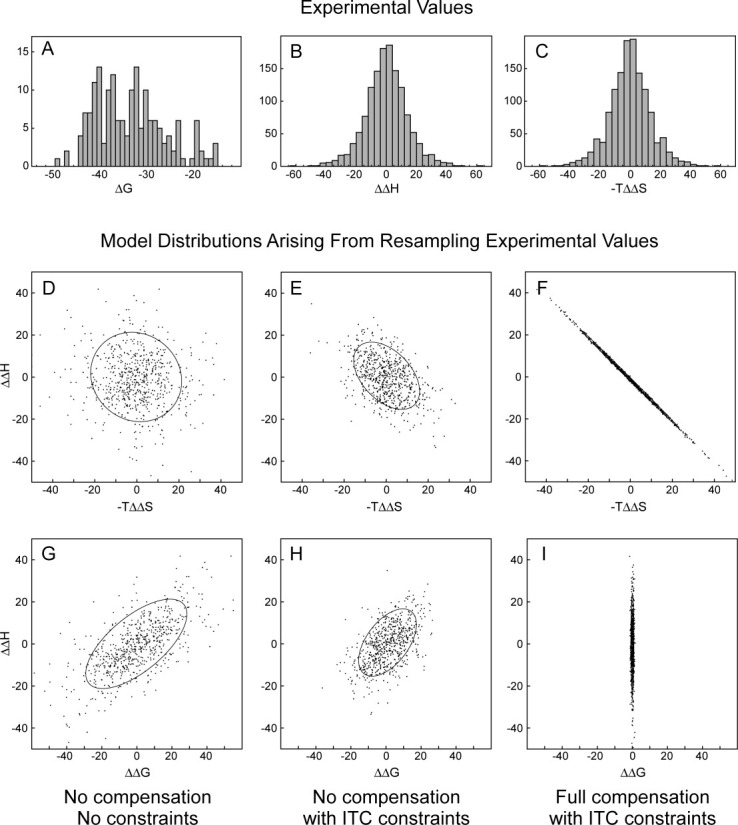
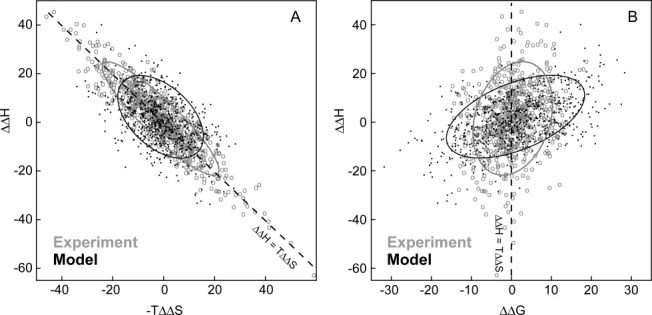
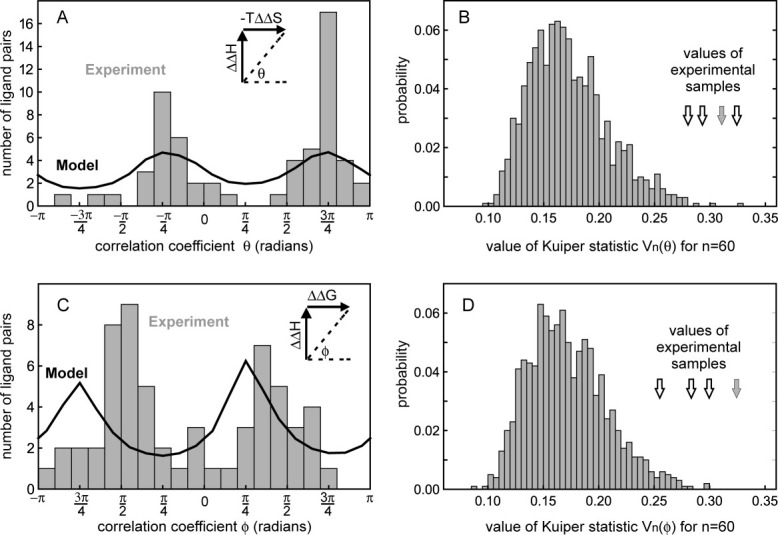
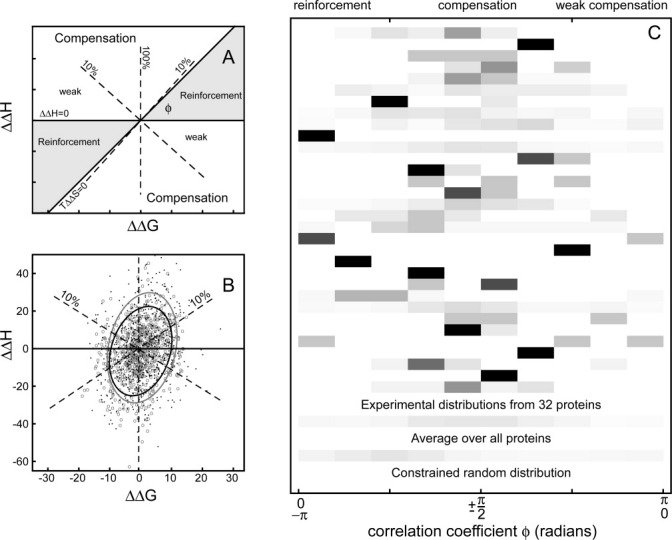
The extent of enthalpy-entropy compensation in protein-ligand interactions has long been disputed because negatively correlated enthalpy (ΔH) and entropy (TΔS) changes can arise from constraints imposed by experimental and analytical procedures as well as through a physical compensation mechanism. To distinguish these possibilities, we have created quantitative models of the effects of experimental constraints on isothermal titration calorimetry (ITC) measurements. These constraints are found to obscure any compensation that may be present in common data representations and regression analyses (e.g., in ΔH vs. -TΔS plots). However, transforming the thermodynamic data into ΔΔ-plots of the differences between all pairs of ligands that bind each protein diminishes the influence of experimental constraints and representational bias. Statistical analysis of data from 32 diverse proteins shows a significant and widespread tendency to compensation. ΔΔH versus ΔΔG plots reveal a wide variation in the extent of compensation for different ligand modifications. While strong compensation (ΔΔH and -TΔΔS opposed and differing by < 20% in magnitude) is observed for 22% of modifications (twice that expected without compensation), 15% of modifications result in reinforcement (ΔΔH and -TΔΔS of the same sign). Because both enthalpy and entropy changes arise from changes to the distribution of energy states on binding, there is a general theoretical expectation of compensated behavior. However, prior theoretical studies have focussed on explaining a stronger tendency to compensation than actually found here. These results, showing strong but imperfect compensation, will act as a benchmark for future theoretical models of the thermodynamic consequences of ligand modification.
Copyright © 2011 The Protein Society.
Figures
Similar articles
-
The Enthalpy-entropy Compensation Phenomenon. Limitations for the Use of Some Basic Thermodynamic Equations.Curr Protein Pept Sci. 2018;19(11):1088-1091. doi: 10.2174/1389203719666180521092615. Curr Protein Pept Sci. 2018. PMID: 29779476 Free PMC article. Review.
-
Intrinsic Thermodynamics of Protein-Ligand Binding by Isothermal Titration Calorimetry as Aid to Drug Design.Methods Mol Biol. 2019;1964:61-74. doi: 10.1007/978-1-4939-9179-2_5. Methods Mol Biol. 2019. PMID: 30929235
-
PDBcal: a comprehensive dataset for receptor-ligand interactions with three-dimensional structures and binding thermodynamics from isothermal titration calorimetry.Chem Biol Drug Des. 2008 Jun;71(6):529-32. doi: 10.1111/j.1747-0285.2008.00661.x. Epub 2008 May 9. Chem Biol Drug Des. 2008. PMID: 18482338
-
Entropy-enthalpy compensation: role and ramifications in biomolecular ligand recognition and design.Annu Rev Biophys. 2013;42:121-42. doi: 10.1146/annurev-biophys-083012-130318. Annu Rev Biophys. 2013. PMID: 23654303 Free PMC article. Review.
-
Structural and ITC Characterization of Peptide-Protein Binding: Thermodynamic Consequences of Cyclization Constraints, a Case Study on Vascular Endothelial Growth Factor Ligands.Chemistry. 2022 Aug 26;28(48):e202200465. doi: 10.1002/chem.202200465. Epub 2022 Jul 7. Chemistry. 2022. PMID: 35665969 Free PMC article.
Cited by
-
Factors That Determine the Variation of Equilibrium and Kinetic Properties of QM/MM Enzyme Simulations: QM Region, Conformation, and Boundary Condition.J Chem Theory Comput. 2022 Apr 12;18(4):2530-2542. doi: 10.1021/acs.jctc.1c00714. Epub 2022 Feb 28. J Chem Theory Comput. 2022. PMID: 35226489 Free PMC article.
-
Entropy Effects in Intermolecular Associations of Crown-Ethers and Cyclodextrins with Amino Acids in Aqueous and in Non-Aqueous Media.Entropy (Basel). 2021 Dec 24;24(1):24. doi: 10.3390/e24010024. Entropy (Basel). 2021. PMID: 35052050 Free PMC article.
-
Isothermal Titration Calorimetry.Methods Mol Biol. 2021;2263:135-159. doi: 10.1007/978-1-0716-1197-5_5. Methods Mol Biol. 2021. PMID: 33877596
-
N (6)-substituted AMPs inhibit mammalian deoxynucleotide N-hydrolase DNPH1.PLoS One. 2013 Nov 19;8(11):e80755. doi: 10.1371/journal.pone.0080755. eCollection 2013. PLoS One. 2013. PMID: 24260472 Free PMC article.
-
On Enthalpy-Entropy Compensation Characterizing Processes in Aqueous Solution.Entropy (Basel). 2025 Jul 2;27(7):716. doi: 10.3390/e27070716. Entropy (Basel). 2025. PMID: 40724433 Free PMC article. Review.
References
-
- Lumry R, Rajender S. Enthalpy–entropy compensation phenomena in water solutions of proteins and small molecules: a ubiquitous property of water. Biopolymers. 1970;9:1125–1227. - PubMed
-
- Krug RR, Hunter WG, Grieger RA. Statistical interpretation of enthalpy–entropy compensation. Nature. 1976;261:566–567.
-
- Exner O. On the enthalpy–entropy relationship. Coll Czech Chem Commun. 1964;26:1094–1113.
-
- Cornish-Bowden AJ. Enthalpy–entropy compensation: a phantom phenomenon. Bioscience. 2002;27:121–126. - PubMed
Publication types
MeSH terms
Substances
LinkOut - more resources
Full Text Sources
Other Literature Sources
