

PD-L1 co-stimulation contributes to ligand-induced T cell receptor down-modulation on CD8+ T cells
- PMID: 21739608
- PMCID: PMC3191120
- DOI: 10.1002/emmm.201100165
PD-L1 co-stimulation contributes to ligand-induced T cell receptor down-modulation on CD8+ T cells
Abstract
T cell receptor (TCR) down-modulation after antigen presentation is a fundamental process that regulates TCR signal transduction. Current understanding of this process is that intrinsic TCR/CD28 signal transduction leads to TCR down-modulation. Here, we show that the interaction between programmed cell death 1 ligand 1 (PD-L1) on dendritic cells (DCs) and programmed death 1 (PD-1) on CD8 T cells contributes to ligand-induced TCR down-modulation. We provide evidence that this occurs via Casitas B-lymphoma (Cbl)-b E3 ubiquitin ligase up-regulation in CD8 T cells. Interference with PD-L1/PD-1 signalling markedly inhibits TCR down-modulation leading to hyper-activated, proliferative CD8 T cells as assessed in vitro and in vivo in an arthritis model. PD-L1 silencing accelerates anti-tumour immune responses and strongly potentiates DC anti-tumour capacities, when combined with mitogen-activated kinase (MAPK) modulators that promote DC activation.
Copyright © 2011 EMBO Molecular Medicine.
Figures
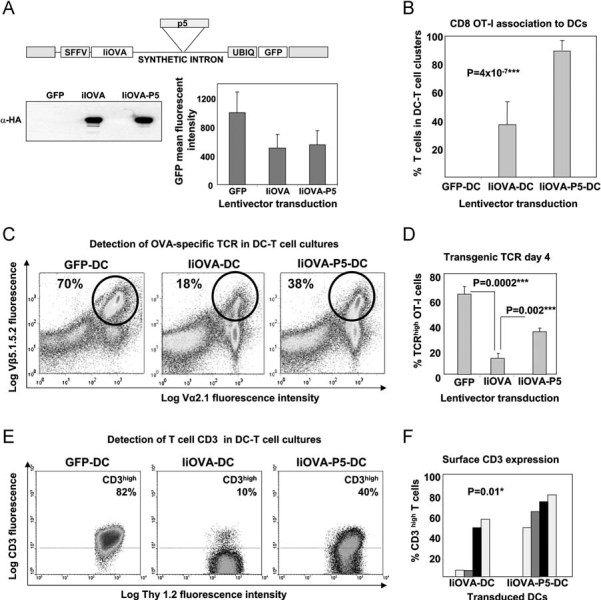
Lentivector co-delivery platform of IiOVA with shRNA-p5 (top). IiOVA expression (immunoblot, lower left) and GFP expression (graph, right).
Association between lentivector transduced DCs and antigen specific OT-I cells as indicated. Associated DC-T cells were quantified by microscopy.
Surface expression of transgenic OVA TCR chains in OT-I cells co-cultured for 4 days with DCs transduced with the indicated lentivectors (top). Transgenic OT-I cells are Vβ5.1.5.2high and Vα2.1high (circles), the their percentages shown within the gate.
As in (C), but plotting transgenic OVA-specific TCR surface expression in OT-I CD8+ T cells co-cultured with the indicated transduced DCs (bottom), as a bar graph with error bars (standard deviations). ***, highly significant differences.
As in (C), with CD3 surface expression in Thy1.2-gated T cells. Percentages refer to CD3high T cells within the upper gate, delimited with a horizontal dotted line. Thy1.2 remains unchanged.
Bar graph as in (E) plotting results from four independent experiments. Each of the experiments is represented as a differently shaded pair of bars. *, significant differences.
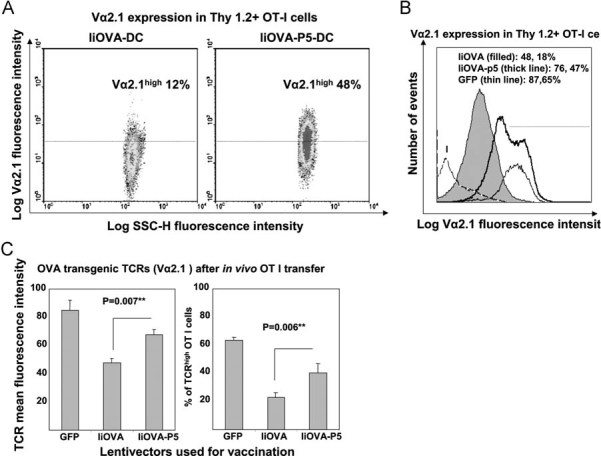
Flow cytometry of OVA-specific transgenic TCR (Vα2.1 chain) surface expression in transferred Thy1.2+ CD8+ T cells in mice vaccinated with DCs transduced with the indicated lentivectors on top of the graph. Percentages of high Vα2.1 OT-I cells are shown within the graphs.
As in (A), but in the form of a histogram comparing vaccinations with transduced DCs, including the GFP-DC vaccination control. Very low numbers of Thy1.2+ cells were found in GFP-DC vaccinated mice due to lack of proliferation. Lentivectors used for DC transductions are shown within the legend. Numbers refer to Vα2.1 mean fluorescent intensities, and the percentage to Vα2.1-positive OT-I cells, as defined by those cells within the 95% isotype gate (horizontal dotted line). The horizontal dotted line delimits the gate in which 95% of isotype-stained CD8+ T cells are excluded. I, Isotype staining control.
OVA-specific TCR surface expression as in (B) in OT-I adoptively transferred into mice vaccinated with DCs transduced with the indicated lentivectors (bottom). **, indicate very significant differences.
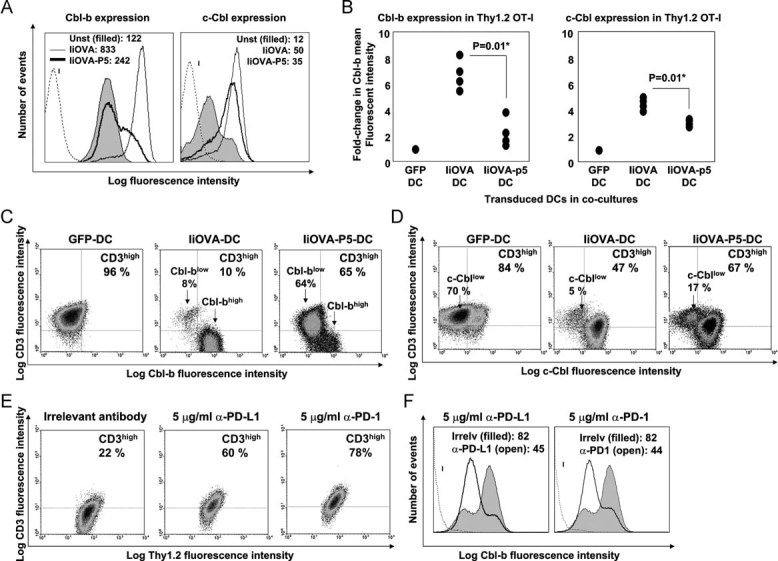
Intracellular expression of Cbl-b and c-Cbl in OT-I cells co-cultured with lentivector-transduced DCs. Lentivectors used for transduction are indicated in the legend within the histograms. Numbers indicate mean fluorescent intensities. I, isotype control.
Same as (A), as a scatter plot representing the fold-change in Cbl mean fluorescent intenisty compared to T cells co-cultured with GFP-DCs. Four independent experiments are plotted and analysed with the Mann–Whitney U-test. *, significant differences.
Cbl-b and surface CD3 expression in OT-I cells co-cultured with lentivector-transduced DCs as indicated on top of the density plots. Percentages of CD3high T cells are shown, as well as populations with different Cbl levels (arrows).
Same as in (C), but detecting c-Cbl.
Surface CD3 and Thy1.2 expression in OT-I cells co-cultured with DCs expressing IiOVA, in the presence of the indicated concentrations of PD-L1 or PD-1 blocking antibodies (top of each graph). Percentages of CD3high T cells are indicated within each density plot.
As in (E) but intracellular Cbl-b expression, represented as a histogram and gating in Thy1.2+ T cells. Histograms in this figure came from a single experiment out of two independent experiments. Mean fluorescent intensities are shown. I, isotype control.
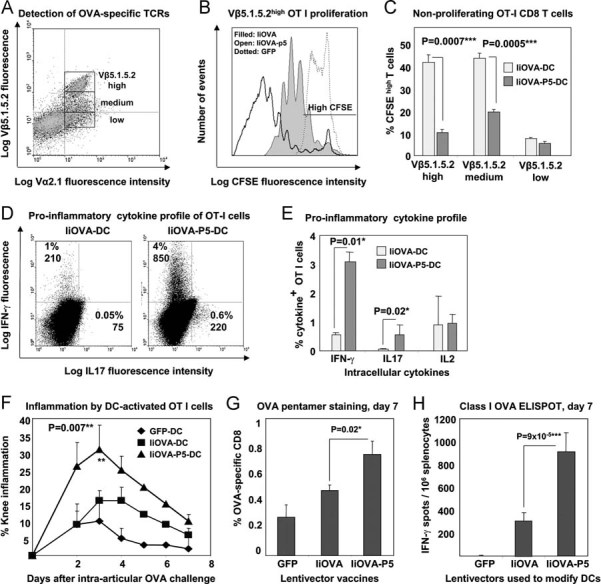
The gating of OT-I cells according to Vβ5.1.5.2 expression is shown. T cell populations were separated into high, medium and low surface expression for proliferation analyses by CFSE dilution in TCRhigh OT-I co-cultured with lentivector-transduced DCs.
Flow cytometry analyses of CFSE dilution in Vβ5.1.5.2high OT-I cells co-cultured for 4 days with DCs transduced with the indicated lentivectors (shown within the graph). The horizontal line within the graph delimits CFSE high T cells (95% of unstimulated OT-I).
Same as B, showing the mean percentages of CFSE high OT-I cells with error bars are plotted (three experiments) according to Vβ5.1.5.2 surface expression (bottom). ***, highly significant differences.
IFN-γ and IL-17 expression in OT-I cells co-cultured with lentivector-transduced DCs (top). Percentage and mean fluorescent intensities are shown within the gates.
As in (D), plotting mean percentages and error bars from three experiments, including IL-2 expression. *, significant differences.
Knee inflammation after intra-articular challenge with OVA in groups of five mice. One day before challenge, OT-I cells were co-cultured with lentivector-transduced DCs (legends within the graph) and intravenously transferred. Means are plotted with error bars (standard deviations). **, very significant differences.
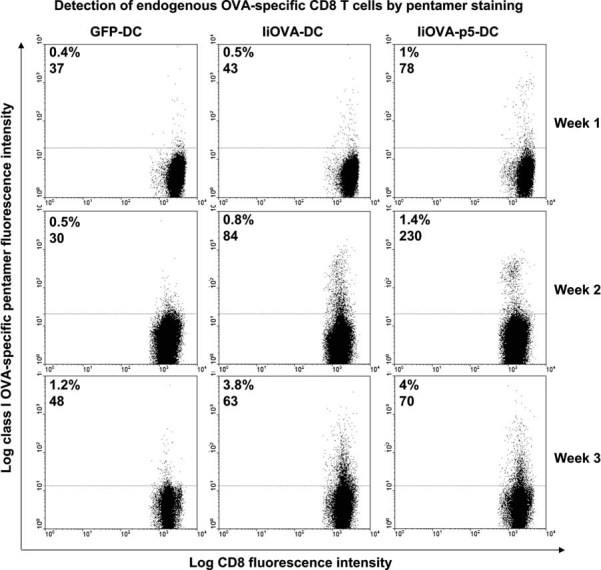
Percentage of OVA-specific endogenous CD8+ T cells in draining lymph nodes stained with class I OVA-pentamers, on day 7 after vaccination with the indicated lentivectors used for DC transduction (bottom). Means and error bars from three experiments are plotted.
CD8+ responses by IFN-γ ELISPOT on day 7 after vaccination with lentivector-transduced DCs (bottom).
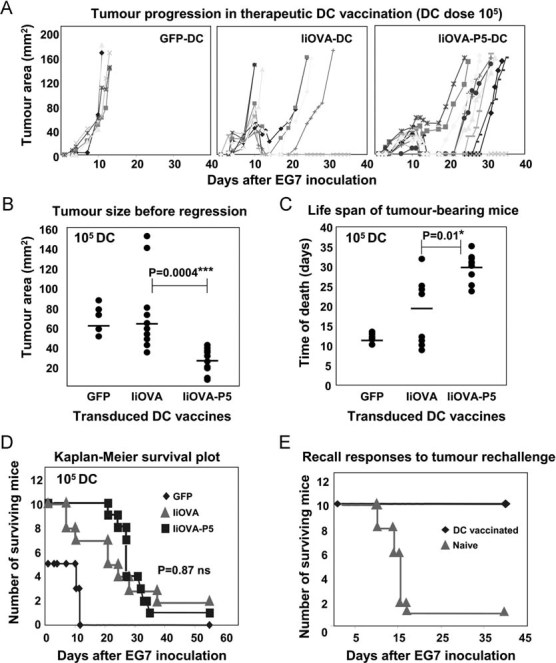
Tumour progression in mice vaccinated with lentivector-transduced DCs. Data from individual mice are represented as independent lines.
Same as (A) but on day 10 (peak of tumour size). Each mouse represented as a dot. Means from each group are indicated within the graph with horizontal lines. Comparisons were performed with the Mann–Whitney U-test. ***, highly significant differences.
Time of death from tumour bearing mice. Vaccination groups indicated on the bottom. Means from each group are indicated within the graph with horizontal lines. Comparisons were performed with the Mann–Whitney U-test. *, significant differences.
As in (A), representing the Kaplan–Meier survival plot. Statistical significance was tested with the log-rank test. Ns, no significant differences.
Kaplan–Meier survival plot-in surviving tumour-free mice from experiments as in (D), re-challenged with EG7 lymphoma cells. A control group with naive mice was used.
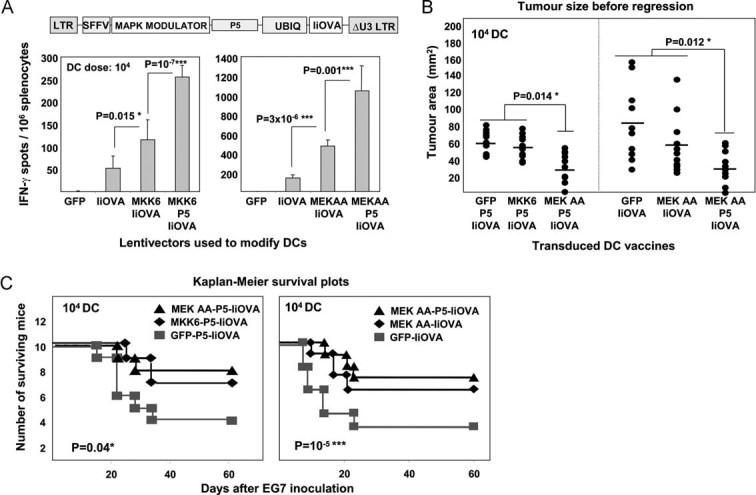
Top, lentivector structure used for the experiments. Bottom, graphs represent CD8+ T cell responses by IFN-γ ELISPOT-In splenocytes 7 days after vaccination with the indicated lentivector-transduced DCs. MKK6, the p38 activator MKK6EE mutant; MEK AA, the ERK inhibitor MEK1 ΔNES AA.
Tumour size on day 8 (peak of tumour size) in mice vaccinated with the indicated lentivector-transduced DCs. Group combinations from two different experiments have been combined in a single graph, and are separated with a vertical dotted line. Means from each group are indicated within the graph with horizontal lines. Statistical comparisons were performed using the Kruskall–Wallis non-parametric test. *, significant differences.
As in (B), but representing the Kaplan–Meier survival plots. Vaccination groups are indicated within the plots. Statistical significance was tested with the log-rank test. *, significant differences; ***, highly significant differences.
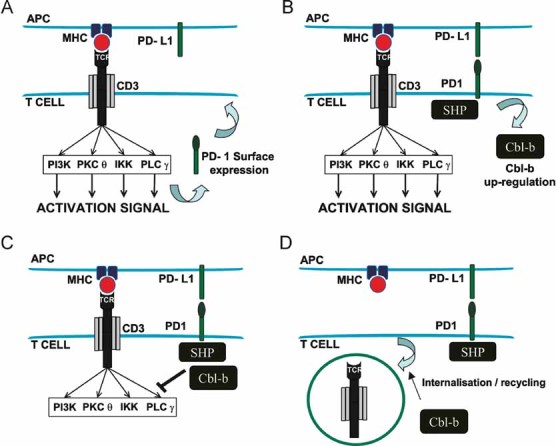
Antigen presenting cell (APC; top) presents antigen in the context of MHC. T cell TCR recognizes the antigen (together with CD80–CD28 binding, not shown for simplification purposes) and leads to activating signal transduction. PD-1 surface expression is up-regulated.
PD-1 on the surface engages with PD-L1 on the APC's surface, leading to recruitment of SHP phosphatases and up-regulating Cbl-b expression.
SHP and Cbl-b de-phosphorylate and inactivate by ubiquitination, respectively, key components of the TCR signal transduction machinery.
Cbl-b either triggers TCR down-modulation, or shifts the recycling equilibrium towards retention of TCR complexes.
References
-
- Arce F, Breckpot K, Stephenson H, Karwacz K, Ehrenstein MR, Collins M, Escors D. Selective ERK activation differentiates mouse and human tolerogenic dendritic cells, expands antigen-specific regulatory T cells, and suppresses experimental inflammatory arthritis. Arthritis Rheum. 2011;63:84–95. - PMC - PubMed
-
- Bachmaier K, Krawczyk C, Kozieradzki I, Kong YY, Sasaki T, Oliveira-dos-Santos A, Mariathasan S, Bouchard D, Wakeham A, Itie A, et al. Negative regulation of lymphocyte activation and autoimmunity by the molecular adaptor Cbl-b. Nature. 2000;403:211–216. - PubMed
-
- Barber DL, Wherry EJ, Masopust D, Zhu B, Allison JP, Sharpe AH, Freeman GJ, Ahmed R. Restoring function in exhausted CD8 T cells during chronic viral infection. Nature. 2006;439:682–687. - PubMed
-
- Breton G, Yassine-Diab B, Cohn L, Boulassel MR, Routy JP, Sekaly RP, Steinman RM. siRNA knockdown of PD-L1 and PD-L2 in monocyte-derived dendritic cells only modestly improves proliferative responses to Gag by CD8(+) T cells from HIV-1-infected individuals. J Clin Immunol. 2009;29:637–645. - PMC - PubMed
Publication types
MeSH terms
Substances
Grants and funding
LinkOut - more resources
Full Text Sources
Other Literature Sources
Research Materials
Miscellaneous
