. 2011 Sep 2;411(5):1128-44.
doi: 10.1016/j.jmb.2011.06.042. Epub 2011 Jun 30.

Thermodynamics and kinetics of the hairpin ribozyme from atomistic folding/unfolding simulations

Affiliations

Thermodynamics and kinetics of the hairpin ribozyme from atomistic folding/unfolding simulations

Lucas G Nivón et al. J Mol Biol. .

Abstract

We report a set of atomistic folding/unfolding simulations for the hairpin ribozyme using a Monte Carlo algorithm. The hairpin ribozyme folds in solution and catalyzes self-cleavage or ligation via a specific two-domain structure. The minimal active ribozyme has been studied extensively, showing stabilization of the active structure by cations and dynamic motion of the active structure. Here, we introduce a simple model of tertiary-structure formation that leads to a phase diagram for the RNA as a function of temperature and tertiary-structure strength. We then employ this model to capture many folding/unfolding events and to examine the transition-state ensemble (TSE) of the RNA during folding to its active "docked" conformation. The TSE is compact but with few tertiary interactions formed, in agreement with single-molecule dynamics experiments. To compare with experimental kinetic parameters, we introduce a novel method to benchmark Monte Carlo kinetic parameters to docking/undocking rates collected over many single molecular trajectories. We find that topology alone, as encoded in a biased potential that discriminates between secondary and tertiary interactions, is sufficient to predict the thermodynamic behavior and kinetic folding pathway of the hairpin ribozyme. This method should be useful in predicting folding transition states for many natural or man-made RNA tertiary structures.


Figures

Figure 1
Figure 1
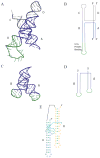
Structure of the four-way junction hairpin ribozyme and the two-way junction model used for simulation. (A) The crystal structure, 1M5K, (absent U1A co-crystallization protein) is shown in cartoon form, with the two-way junction hairpin ribozyme bases colored in blue . Regions removed from this structure in order to build the two-way junction model are the U1A binding loop (green) and domains C and D (gray). Note that the simulation uses all heavy atoms, but for clarity we display only the cartoon model here. (B) A schematic diagram of the secondary structure of the full ribozyme from 1M5K with the same color scheme. (C) The cartoon representation of the model of the two-way junction, hp2d, with loops modeled in from the structure of the isolated Domain B NMR structure(1B36). The portions of the structure retained from the 1M5K structure are in blue, while loops added from 1B36 are colored in green. (D) A schematic secondary structure diagram of hp2d using the same color scheme. (E) A detailed schematic of hp2d showing all nucleotides, with secondary interactions in green and tertiary in cyan. Within the secondary interactions, dashes indicate canonical Watson-Crick base pairings, while non-canonical pairs are indicated with a dot. Domain A is in blue, domain B in yellow.
Figure 2
Figure 2
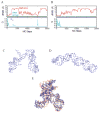
Sample trajectories and structures from unfolding simulations of the hairpin ribozyme with τ/S = 0. (A) Trajectories of total dRMS (Å), domain dRMS and fraction of native contacts as a function of number of MC steps show undocking with brief re-docking and (B) undocking without re-docking, but with excursions to an extended “stacked” structure. For A and B total dRMS (red; Å) and the sum of domain A + domain B dRMS (green; Å) is shown in the top panel. The fraction of native secondary contacts (Qsec; dark blue) and native tertiary contacts (Qtert; light blue) is shown in the bottom panel. (C) Undocked structures occupy a wide swath of structural space away from the stacked structure. (D) An example of the stacked structure. (E) An overlay of a re-docked structure (blue) and the native structure (orange) shows that the re-docked structure is native.
Figure 3
Figure 3
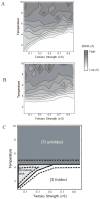
τ/S and temperature phase diagram of the hairpin ribozyme. The phase diagram was mapped out over τ/S = 0.0 to 1.0 (steps of 0.1) and T = 1 to 10 (steps of 1). The ratio τ/S serves as a proxy for experimentally measurable cation concentration in these thermodynamic calculations. Three folding simulations were carried out at each spot in the phase space (A and B). (A) The averaged total dRMS (Å) at each spot, indicating overall structure formation. (B) The averaged dRMS for domain A plus domain B, calculated separately, indicating secondary structure alone. Higher dRMS (Å; less native) is darker. Comparison of the overall dRMS (A) with the isolated region dRMS (B) shows a discrepancy at low T and τ/S, where overall dRMS is intermediate while regional dRMS is very low, indicating loss of tertiary structure with maintenance of secondary structure. By superimposing overall dRMS (A) and domain A + B dRMS (B), one can delineate the three state phase diagram. (C) The regions of phase diagram are shown schematically based on the results of (A and B) in this diagram, showing folded, unfolded and docking regions.
Figure 4
Figure 4
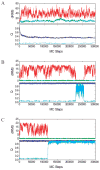
Folding trajectories in three different regions of the phase diagram (Figure 3C). Folding runs were carried out in three regions of phase space: (A) unfolded (region 1), (B) docking/undocking (region 2) and (C) folded without subsequent undocking (region 3). A structure with intact secondary domains, UD, was extracted from unfolding simulations. Total dRMS (Å; red) and the sum of domain A + domain B dRMS (Å; green) is shown in the top panel. The fraction of native secondary contacts (Qsec; dark blue) and native tertiary contacts (Qtert; light blue) is shown in the bottom panel. (A) Folding simulations from the undocked structure, in region 1, unfolded. Note that overall and domain dRMS quickly jump to high values and that Qsec rapidly equilibrates to a low value, indicating unfolding of domains, while Qtert never rises, indicating a lack of any docking. (B) A folding trajectory in region 2 with docking and subsequent undocking. Note in the upper trace that the domain dRMS remains low, while overall dRMS only falls to low values near 230,000 steps, indicating folding. The Qsec remains high throughout, and Qtert only rises during docking. (C) A folding trajectory in region 3 with docking but no subsequent undocking. Undocking is never observed in region 3. The upper trace indicates folding to low overall dRMS around 120,000 steps. The fraction of native tertiary contacts jumps to a stable high value upon folding, while Qsec is not affected.
Figure 5
Figure 5
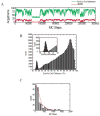
Histogram of the docking/undocking region and schematic of docked/undocked energy landscape. (A) Histogram of dRMS (Å)and Qtert for 30 folding runs in region 2. High density is in dark gray, low density in light gray or white. (B) Undock dwells are defined as the time from the beginning of the simulation until the dRMS (in red) falls under 0.5 Angstroms. The docked state is defined from the end of the undocked state (first excursion of dRMS under 0.5 Å) until the dRMS rises significantly (over 10.0 Å). (C) A schematic of the folding free energy landscape for docking, showing minima at undocked (U) and docked (D). In order to pass from U to D the molecule necessarily traverses a transition state at the free energy maximum. The rate constants kdock and kundock are indicated on the landscape, as well as the influence of stabilization of the D state by increasing τ, or the tertiary interaction strength (dashed blue line).
Figure 6
Figure 6
Undock and dock dwell times as a function of τ, and the docking and undocking rates derived from distributions. Dock and undock dwells were measured over ~50 simulations at τ of 0.10 (56), 0.15 (46), 0.20 (54) and 0.25 (44) (numbers in parentheses indicate the number of folding runs at that condition), with the dwells as defined in Figure 5B. All dwells are fit to a single exponential function of the form y = A * (1− exp(−x/t)), where A is the amplitude and t is the exponential constant. (A) The cumulative undock dwell times with corresponding single exponential fits shown in red. (B) The cumulative dock dwell times with corresponding single exponential fits shown in red. (C) The dock and undock rates (1/t) derived from the exponential fits at each τ value. Note that the undock rates vary as a function of τ, becoming slower at higher τ, while the dock rates are not affected by varying τ. (D) The rates (1/t) plotted on a logarithmic scale to show detail at the slow rates around τ = 0.20 and 0.25.
Figure 7
Figure 7
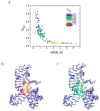
Pfold and simulated phi values for the hairpin ribozyme. (A) The results of Pfold calculations for 128 structures are shown. For each structure we calculate Qtert and the dRMS (Å), and then indicate Pfold by color as indicated in the legend. Intermediate Pfold values, indicating members of the TSE, are in green, while pre-TS structures are in red or yellow and post-TS structures are in blue. (B) The location of non-zero phi value nucleotides on the hairpin ribozyme. Nucleotides are colored according to the atom with maximum phi value. Nucleotides with no phi values above 0.05 are in blue. Those nucleotides with phi > 0.05 are colored red or yellow with nucleotides containing atoms with a phi over 0.2 in red, and nucleotides with maximum atomic phi values lower than 0.2 in yellow. (C) Nucleotides with any atoms showing tertiary contacts with the other domain are shown in green.
Figure 8
Figure 8
Conformational distribution and kinetics of the undocked state. (A) A folding trajectory showing both dRMS (Å; red) and end-to-end distance (Å; green) calculated between the two dye attachment points, U17 at the end of domain A and U50 at the end of domain B. Note the docking event (to a relatively fluctuation-free docked conformation) as well as larger fluctuations within the undocked state, in both end-to-end distance and dRMS (B) Histograms of the end-to-end distance within representative sections of docked and undocked conformations (C) Dwell time distribution in the “collapsed” state defined as dRMS < 56 Angstroms (corresponding to the distance of 0.5 FRET for Cy3 and Cy5 dye pair), derived from a section of undocked conformation with no docking. The dwell times in this state are fit to a single exponential with a time constant of 217 MC steps (red line).

Similar articles

Cited by

References

    1. Lilley DM. Structure, folding and catalysis of the small nucleolytic ribozymes. Current opinion in structural biology. 1999;9:330–8. - PubMed
    1. Lilley DM. Structure, folding and mechanisms of ribozymes. Current opinion in structural biology. 2005;15:313–23. - PubMed
    1. Hampel A, Tritz R. RNA catalytic properties of the minimum (−)sTRSV sequence. Biochemistry. 1989;28:4929–33. - PubMed
    1. Buzayan JM, Gerlach WL, Bruening G. Nonenzymatic Cleavage and Ligation of Rnas Complementary to a Plant-Virus Satellite Rna. Nature. 1986;323:349–353.
    1. Rupert PB, Ferre-D’Amare AR. Crystal structure of a hairpin ribozyme-inhibitor complex with implications for catalysis. Nature. 2001;410:780–6. - PubMed

LinkOut - more resources