

KV7 channels regulate muscle tone and nonadrenergic noncholinergic relaxation of the rat gastric fundus
- PMID: 21740972
- PMCID: PMC3178758
- DOI: 10.1016/j.phrs.2011.06.016
KV7 channels regulate muscle tone and nonadrenergic noncholinergic relaxation of the rat gastric fundus
Abstract
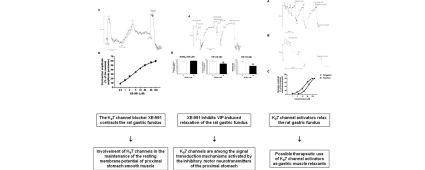
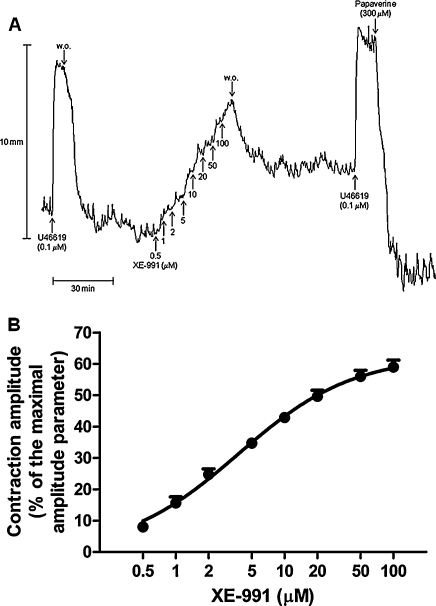
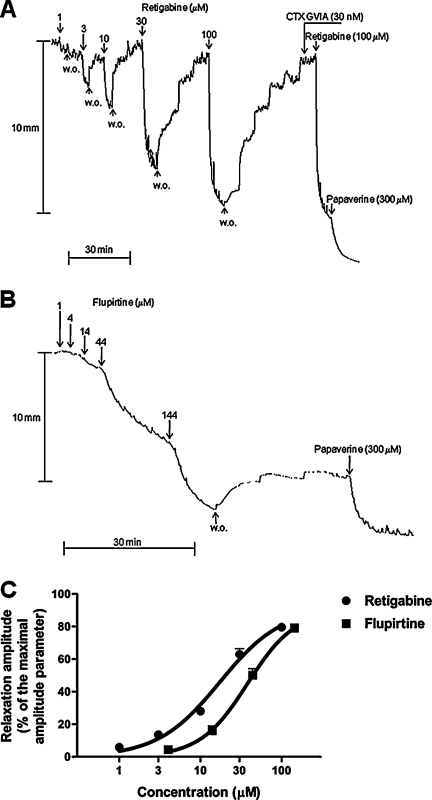
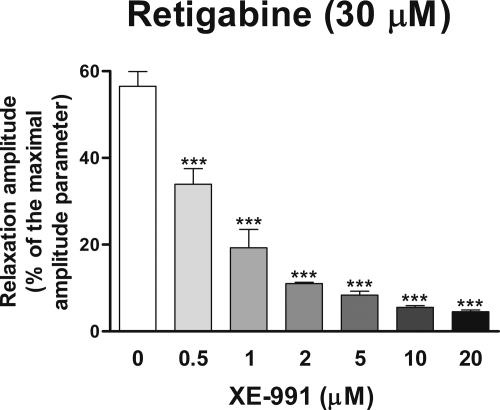
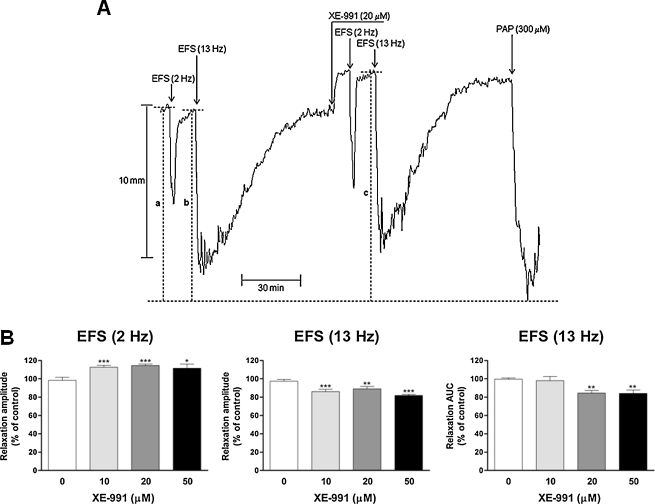
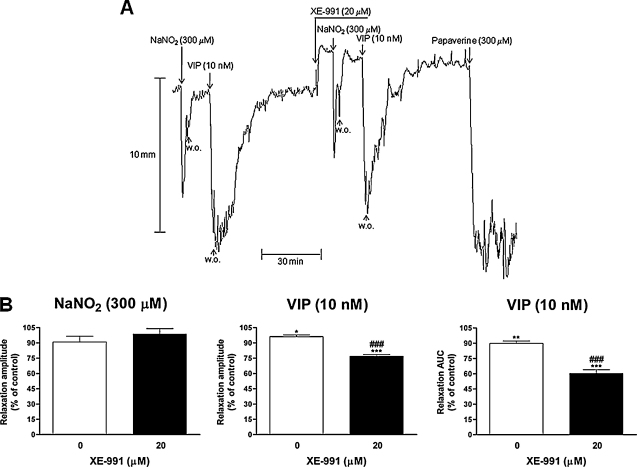
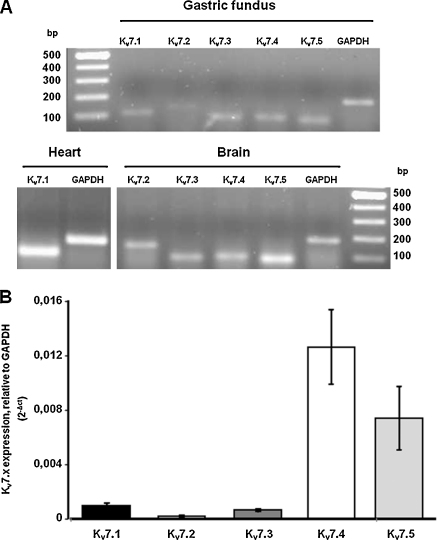
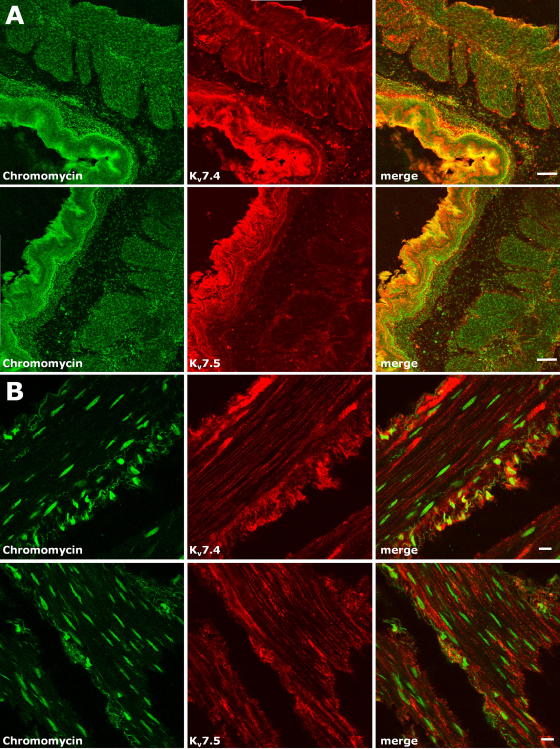
Voltage-dependent type 7 K+ (KV7) channels play important physiological roles in neurons and muscle cells. The aims of the present study were to investigate the motor effects of KV7 channel modulators in the rat gastric fundus and the expression of KV7 channels in this tissue. Muscle tone and electrical field stimulation (EFS)-evoked relaxations of precontracted longitudinal muscle strips of the rat gastric fundus were investigated under nonadrenergic noncholinergic conditions by organ bath studies. Gene expression was studied by real-time PCR and tissue localization of channels was investigated by immunohistochemistry. The KV7 channel blocker XE-991 induced concentration-dependent contractions, with mean pD2 and Emax of 5.4 and 48% of the maximal U46619-induced contraction, respectively. The KV7 channel activators retigabine and flupirtine concentration-dependently relaxed U46619-precontracted strips, with pD2s of 4.7 and 4.4 and Emax of 93% and 91% of the maximal relaxation induced by papaverine, respectively. XE-991 concentration-dependently inhibited retigabine-induced relaxation with a pIC50 of 6.2. XE-991 and DMP-543, another KV7 channel blocker, increased by 13-25% or reduced by 11-21% the relaxations evoked by low- or high-frequency EFS, respectively. XE-991 also reduced the relaxation induced by vasoactive intestinal polypeptide (VIP) by 33% of controls. Transcripts encoded by all KV7 genes were detected in the fundus, with 7.4 and 7.5 showing the highest expression levels. KV7.4 and 7.5 channels were visualized by confocal immunofluorescence in both circular and longitudinal muscle layers. In conclusion, in the rat proximal stomach, KV7 channels appear to contribute to the resting muscle tone and to VIP- and high-frequency EFS-induced relaxation. KV7 channel activators could be useful relaxant agents of the gastric smooth muscle.
Copyright © 2011 Elsevier Ltd. All rights reserved.
Figures
Similar articles
-
One man's side effect is another man's therapeutic opportunity: targeting Kv7 channels in smooth muscle disorders.Br J Pharmacol. 2013 Jan;168(1):19-27. doi: 10.1111/j.1476-5381.2012.02133.x. Br J Pharmacol. 2013. PMID: 22880633 Free PMC article. Review.
-
Expression and motor functional roles of voltage-dependent type 7 K(+) channels in the human taenia coli.Eur J Pharmacol. 2013 Dec 5;721(1-3):12-20. doi: 10.1016/j.ejphar.2013.09.061. Epub 2013 Oct 10. Eur J Pharmacol. 2013. PMID: 24120659
-
Activation of KCNQ channels located on the skeletal muscle membrane by retigabine and its influence on the maximal muscle force in rat muscle strips.Naunyn Schmiedebergs Arch Pharmacol. 2016 Apr;389(4):439-46. doi: 10.1007/s00210-016-1211-0. Epub 2016 Jan 27. Naunyn Schmiedebergs Arch Pharmacol. 2016. PMID: 26815201
-
KV7 channels in the human detrusor: channel modulator effects and gene and protein expression.Naunyn Schmiedebergs Arch Pharmacol. 2017 Feb;390(2):127-137. doi: 10.1007/s00210-016-1312-9. Epub 2016 Oct 19. Naunyn Schmiedebergs Arch Pharmacol. 2017. PMID: 27761601
-
Novel treatment strategies for smooth muscle disorders: Targeting Kv7 potassium channels.Pharmacol Ther. 2016 Sep;165:14-25. doi: 10.1016/j.pharmthera.2016.05.002. Epub 2016 May 11. Pharmacol Ther. 2016. PMID: 27179745 Review.
Cited by
-
Molecular expression and pharmacological evidence for a functional role of kv7 channel subtypes in Guinea pig urinary bladder smooth muscle.PLoS One. 2013 Sep 20;8(9):e75875. doi: 10.1371/journal.pone.0075875. eCollection 2013. PLoS One. 2013. PMID: 24073284 Free PMC article.
-
Differential activation of vascular smooth muscle Kv7.4, Kv7.5, and Kv7.4/7.5 channels by ML213 and ICA-069673.Mol Pharmacol. 2014 Sep;86(3):330-41. doi: 10.1124/mol.114.093799. Epub 2014 Jun 18. Mol Pharmacol. 2014. PMID: 24944189 Free PMC article.
-
One man's side effect is another man's therapeutic opportunity: targeting Kv7 channels in smooth muscle disorders.Br J Pharmacol. 2013 Jan;168(1):19-27. doi: 10.1111/j.1476-5381.2012.02133.x. Br J Pharmacol. 2013. PMID: 22880633 Free PMC article. Review.
-
Clinical utility, safety, and tolerability of ezogabine (retigabine) in the treatment of epilepsy.Drug Healthc Patient Saf. 2012;4:81-6. doi: 10.2147/DHPS.S28814. Epub 2012 Jul 26. Drug Healthc Patient Saf. 2012. PMID: 22888276 Free PMC article.
-
Cholinergic signalling-regulated KV7.5 currents are expressed in colonic ICC-IM but not ICC-MP.Pflugers Arch. 2014 Sep;466(9):1805-18. doi: 10.1007/s00424-013-1425-7. Epub 2013 Dec 28. Pflugers Arch. 2014. PMID: 24375291
References
-
- Gutman G.A., Chandy K.G., Grissmer S., Lazdunsky M., McKinnon D., Pardo L.A. International Union of Pharmacology. LIII. Nomenclature and molecular relationships of voltage-gated potassium channels. Pharmacol Rev. 2005;57:473–508. - PubMed
-
- Miceli F.M., Soldovieri M.V., Martire M., Tagliatatela M. Molecular pharmacology and therapeutic potential of neuronal KV7-modulating drugs. Curr Opin Pharmacol. 2008;8:65–74. - PubMed
Publication types
MeSH terms
Substances
Grants and funding
LinkOut - more resources
Full Text Sources
Other Literature Sources
