Review
. 2011:191:195-209.
doi: 10.1016/B978-0-444-53752-2.00004-7.

Sensory integration for reaching: models of optimality in the context of behavior and the underlying neural circuits

Affiliations
Review

Sensory integration for reaching: models of optimality in the context of behavior and the underlying neural circuits

Philip N Sabes. Prog Brain Res. 2011.

Abstract

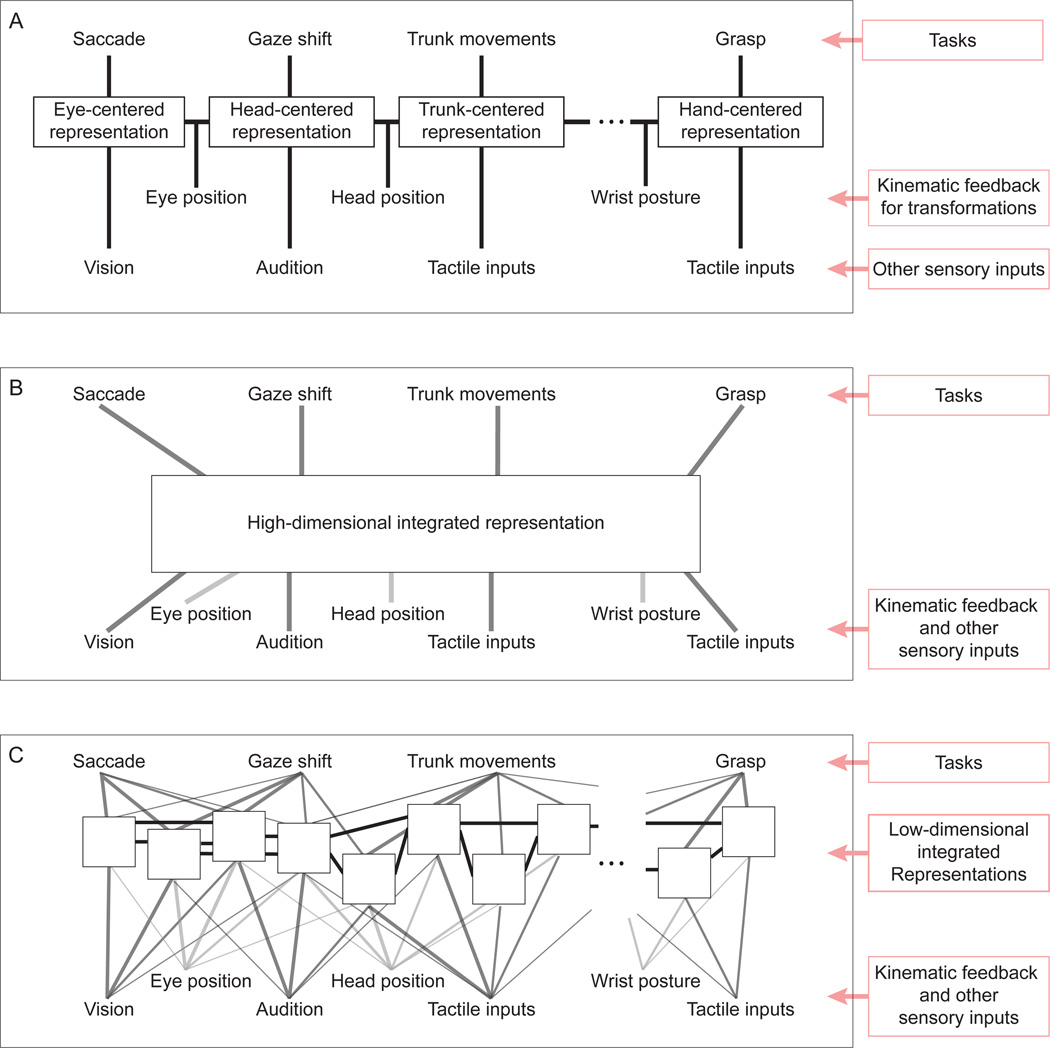
Although multisensory integration has been well modeled at the behavioral level, the link between these behavioral models and the underlying neural circuits is still not clear. This gap is even greater for the problem of sensory integration during movement planning and execution. The difficulty lies in applying simple models of sensory integration to the complex computations that are required for movement control and to the large networks of brain areas that perform these computations. Here I review psychophysical, computational, and physiological work on multisensory integration during movement planning, with an emphasis on goal-directed reaching. I argue that sensory transformations must play a central role in any modeling effort. In particular, the statistical properties of these transformations factor heavily into the way in which downstream signals are combined. As a result, our models of optimal integration are only expected to apply "locally," that is, independently for each brain area. I suggest that local optimality can be reconciled with globally optimal behavior if one views the collection of parietal sensorimotor areas not as a set of task-specific domains, but rather as a palette of complex, sensorimotor representations that are flexibly combined to drive downstream activity and behavior.


Figures

Figure 1
Figure 1. Two separate computations required for reach planning
Adapted from Sober and Sabes (2005).
Figure 2
Figure 2
A. Experimental setup. Left subpanel. Subjects sat in a simple virtual reality apparatus with a mirror reflecting images presented on a rear projection screen (Simani et al., 2007). View of both arms was blocked, but artificial feedback of either arm could be given in the form of a disk of light that moved with the fingertip. The right and left arms were separated by a thin table, allowing subject to reach to their left hand without tactile feedback. We were thus able to manipulate both the sensory modality of the target (visual, proprioceptive, or bimodal) and the presence of absence of visual feedback of the reaching hand. Right subpanel. For each target and feedback condition, reaches were made to an array of targets (displayed individually during the experiment) with the eyes fixated on one of two fixation points. B–D. Reach biases. Average reach angular errors are plotted as a function of target and fixation location, separately for each trial condition (target modality and presence of visual feedback). Target modalities were randomly interleaved across two sessions, one with visual feedback and one without. Solid lines: average reach errors (with standard errors) across eight subjects for each trial condition. Dashed lines: model fits to the data. The color of the line indicates the gaze location. D. Schematic of the Bayesian parallel representations model of reach planning. See text for details. E. Reach variability. Average variability of reach angle plotted for each trial condition. Solid lines: average standard deviation of reach error across subjects for each trial condition. Dashed lines: model predictions. Adapted from McGuire and Sabes (2011).
Figure 3
Figure 3
Schematic illustration of the cortical reach circuit.
Figure 4
Figure 4
A: Recording locations. Approximate location of neural recordings in Area 5 with respect to sulcal anatomy. Recordings in MIP were located in the same region of cortex, but at a deeper penetration depth. The boundary between Area 5 and MIP was set to a nominal value of 2000 µm below the dura. This value was chosen based on anatomical MR images and the stereotactic coordinates of the recording cylinder. B: Schematic illustration of the tuning curve shift, δ. Each curve represents the firing rate for an idealized cell as a function of target for either the left (red) or right (blue) fixation points. Three idealize cells are illustrated, with shift values of δ = 0, 0.5, and 1. See text for more details. C,D: Distribution of shift values estimated from neural recordings in Area 5 (C) and MIP (D). Each cell may be included up to three times, once for the delay, reaction time, and movement epoch tuning curves. The number of tuning curves varies across modalities because tuning curves were only included when the confidence limit on the best-fit value of δ had a range of less than 1.5, a conservative value that excluded untuned cells. Adapted from (McGuire and Sabes, 2011).
Figure 5
Figure 5. Three schematic models of the parietal representations of sensorimotor space
A: A sequence of transformations that follows the kinematics of the body. Each behavior uses the representation that most closely matches the space of the task. B: A single high-dimensional representation that integrates all of the relevant sensorimotor variables and subserves the downstream computations for all tasks. C: A large collection of low-dimensional integrated representations with overlapping sensory inputs and a high degree of interconnectivity. Each white box represents a different representation of sensorimotor space. The nature of these representations is determined by their inputs, and their statistical properties (e.g. variability, gain) will depend on the sensory signals available at the time. The computations performed for any given task make use of several of these representations, with the relative weighting dynamically determined by their statistical properties.

References

    1. Andersen RA, Buneo CA. Intentional maps in posterior parietal cortex. Annu Rev Neurosci. 2002:189–220. - PubMed
    1. Avillac M, Deneve S, Olivier E, Pouget A, Duhamel JR. Reference frames for representing visual and tactile locations in parietal cortex. Nat Neurosci. 2005;8:941–949. - PubMed
    1. Batista AP, Buneo CA, Snyder LH, Andersen RA. Reach plans in eye-centered coordinates. Science. 1999;285:257–260. - PubMed
    1. Beurze SM, de Lange FP, Toni I, Medendorp WP. Integration of target and effector information in the human brain during reach planning. J Neurophysiol. 2007;97:188–199. - PubMed
    1. Bock O. Localization of objects in the peripheral visual field. Behav Brain Res. 1993;56:77–84. - PubMed

Publication types