. 2011 Jul 12;20(1):104-18.
doi: 10.1016/j.ccr.2011.05.027.

miR-30b/30d regulation of GalNAc transferases enhances invasion and immunosuppression during metastasis

Affiliations

miR-30b/30d regulation of GalNAc transferases enhances invasion and immunosuppression during metastasis

Avital Gaziel-Sovran et al. Cancer Cell. .

Abstract

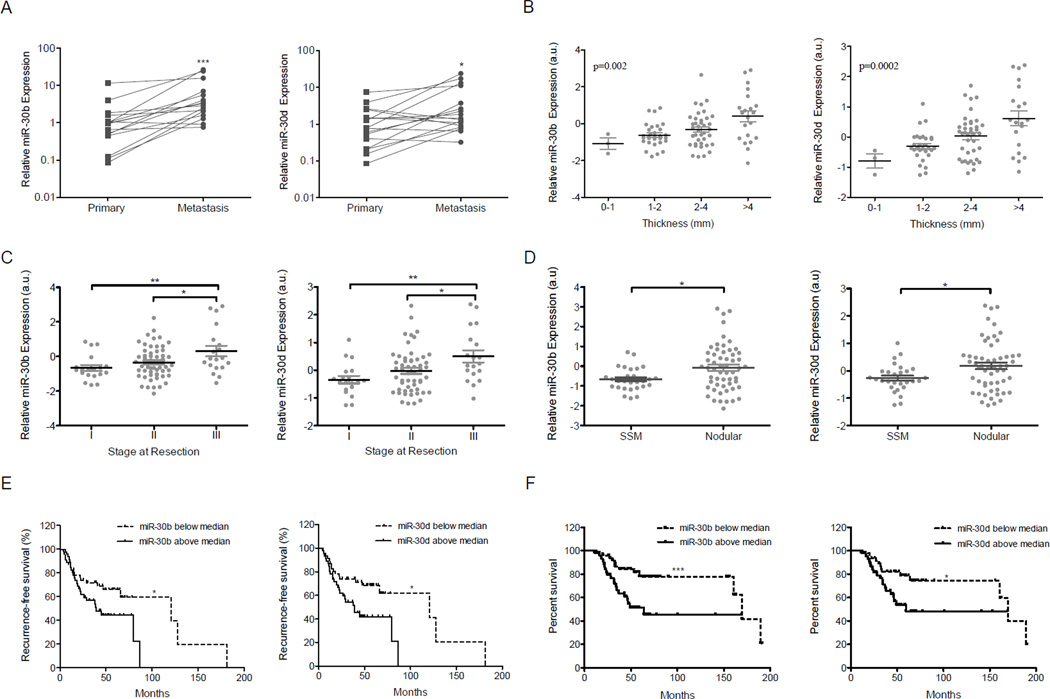
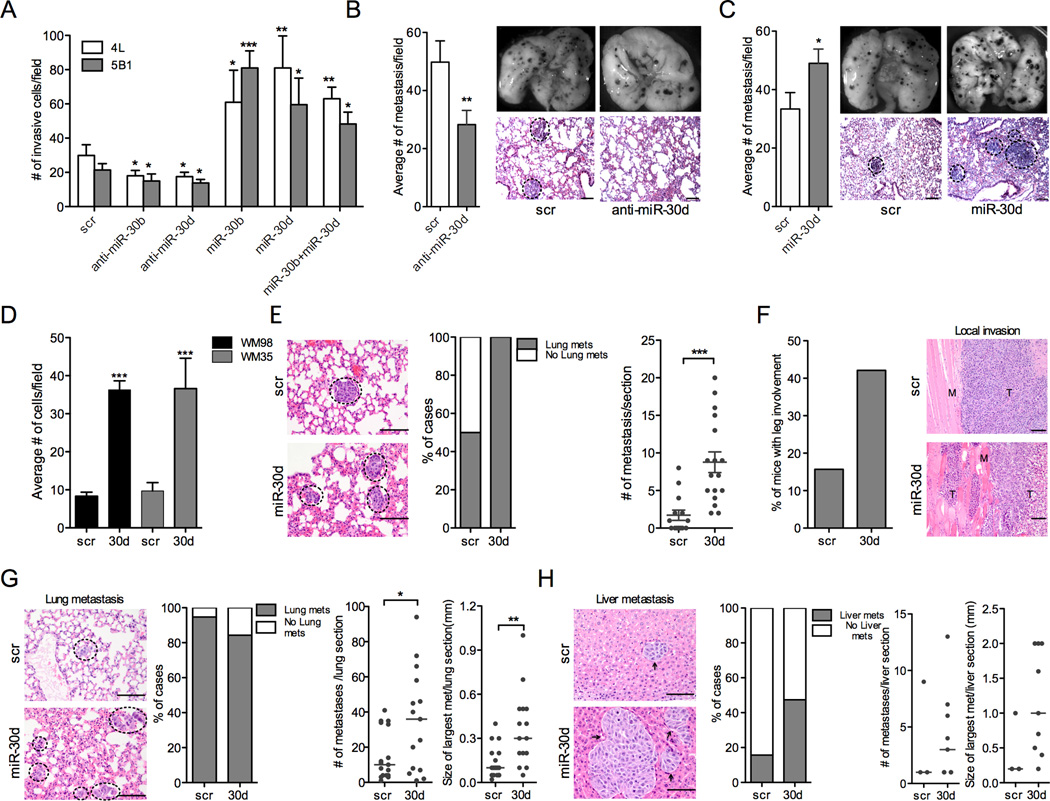
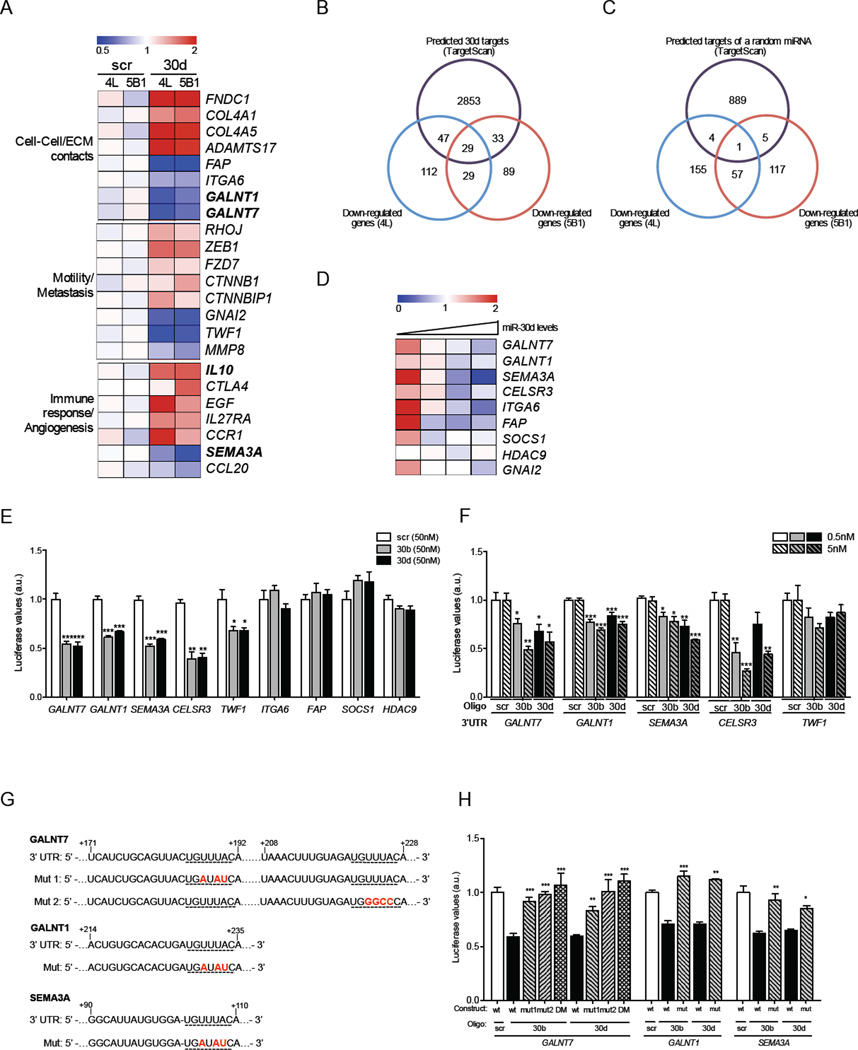
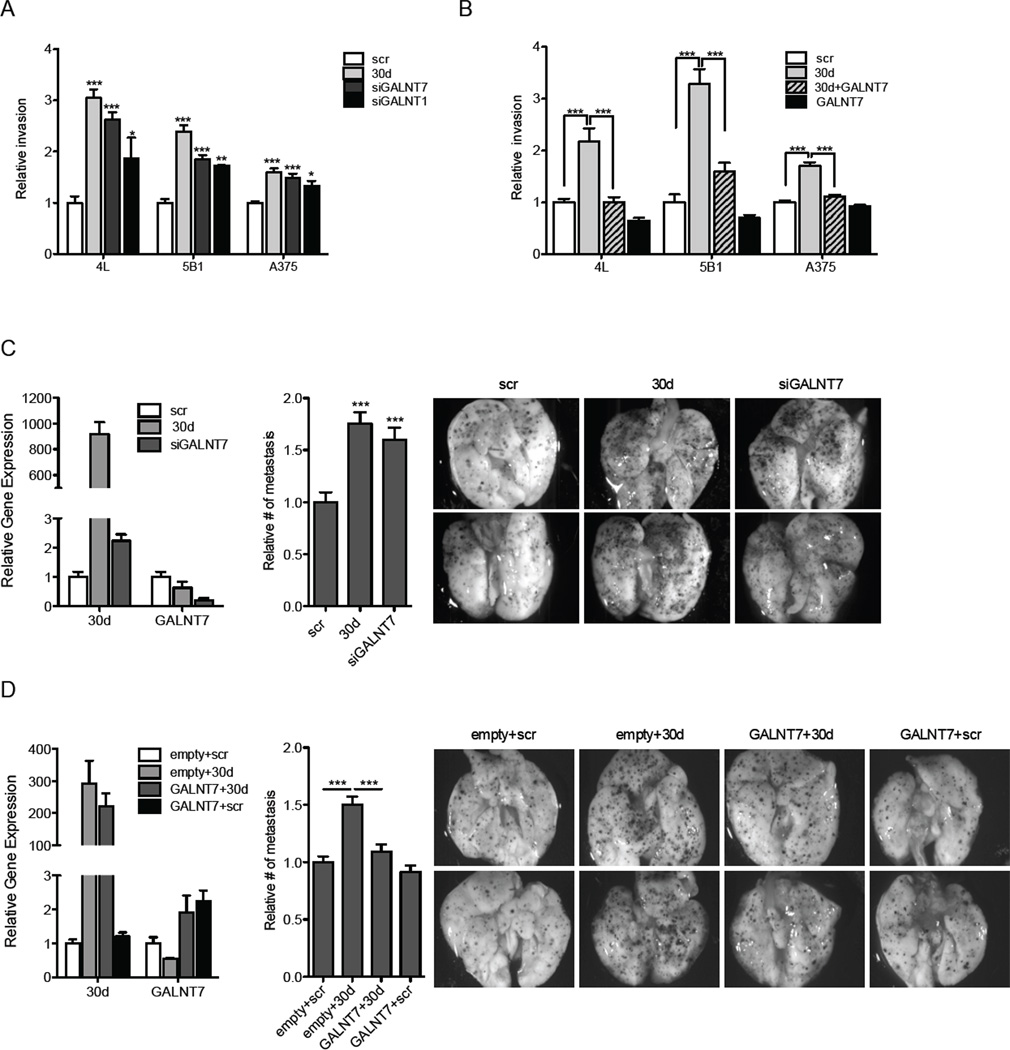
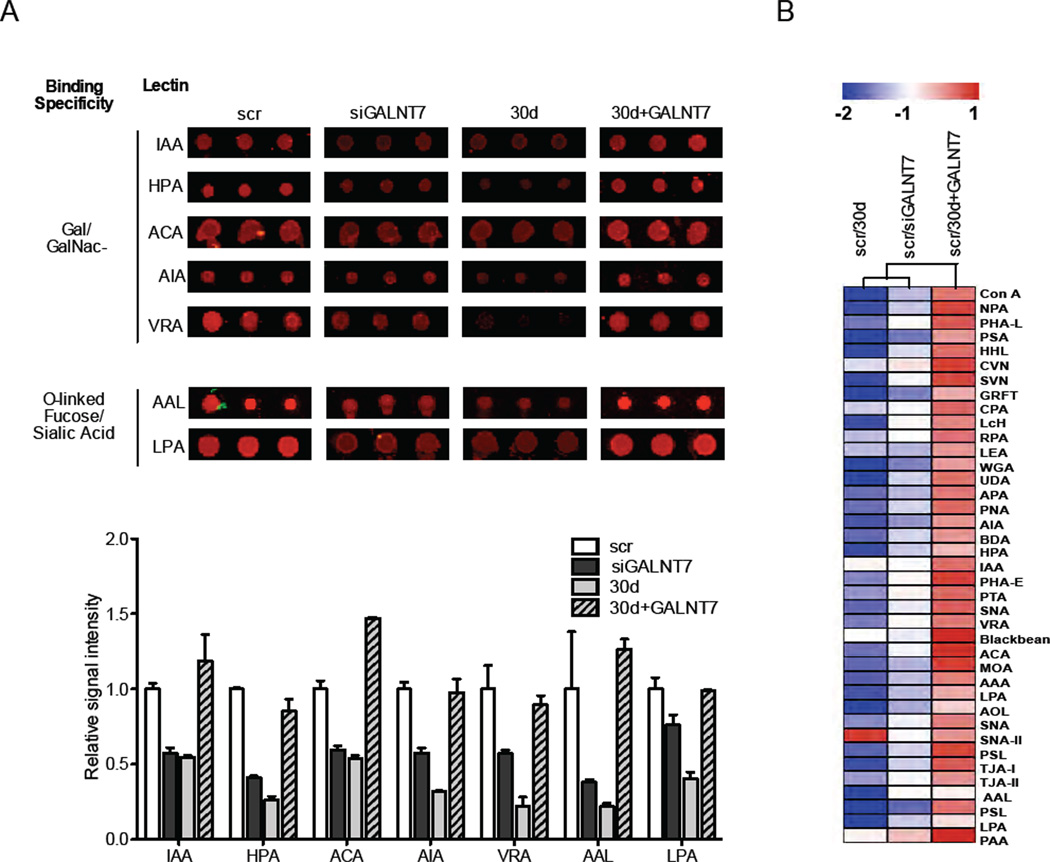
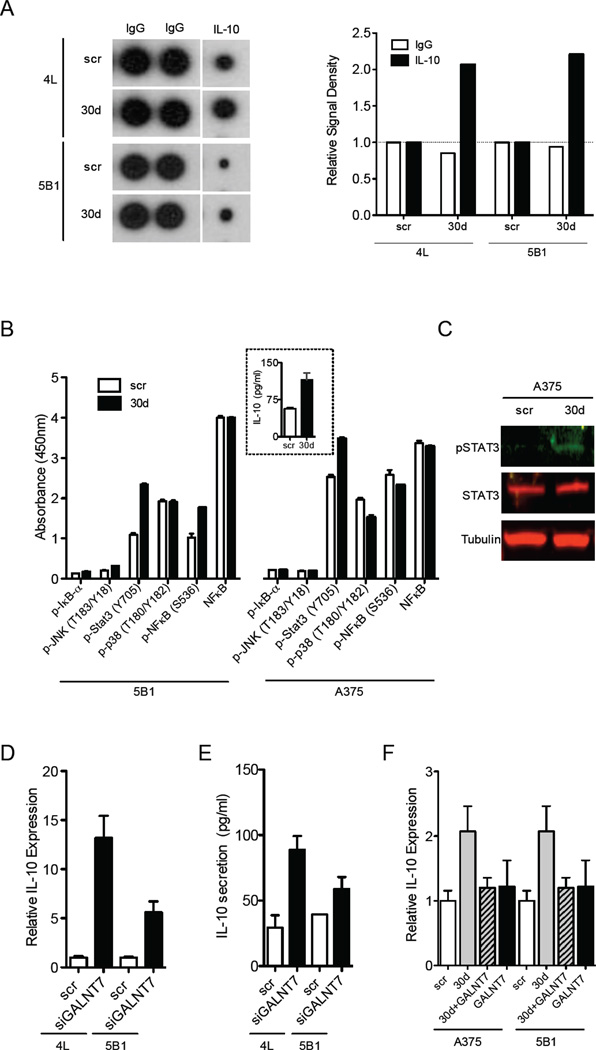
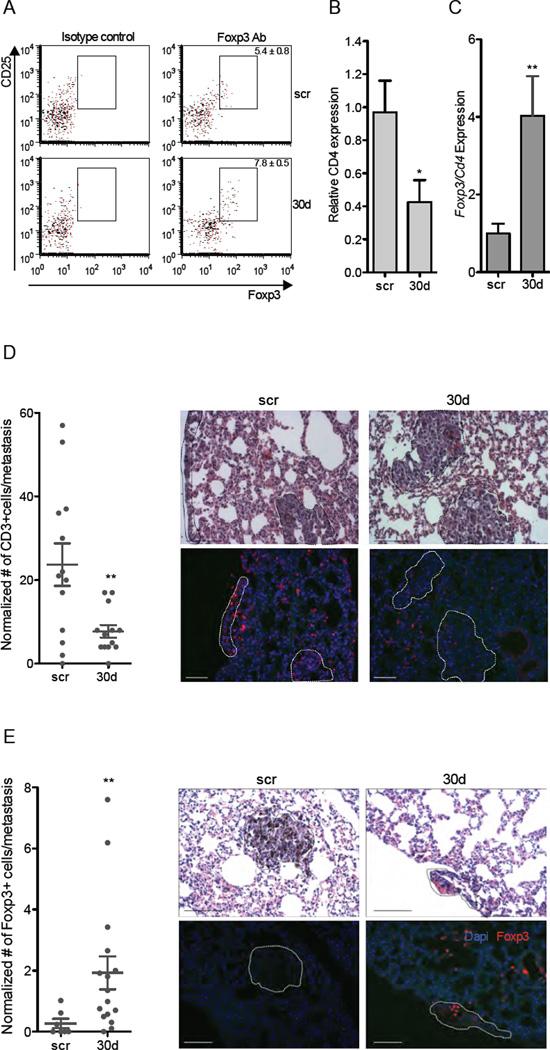
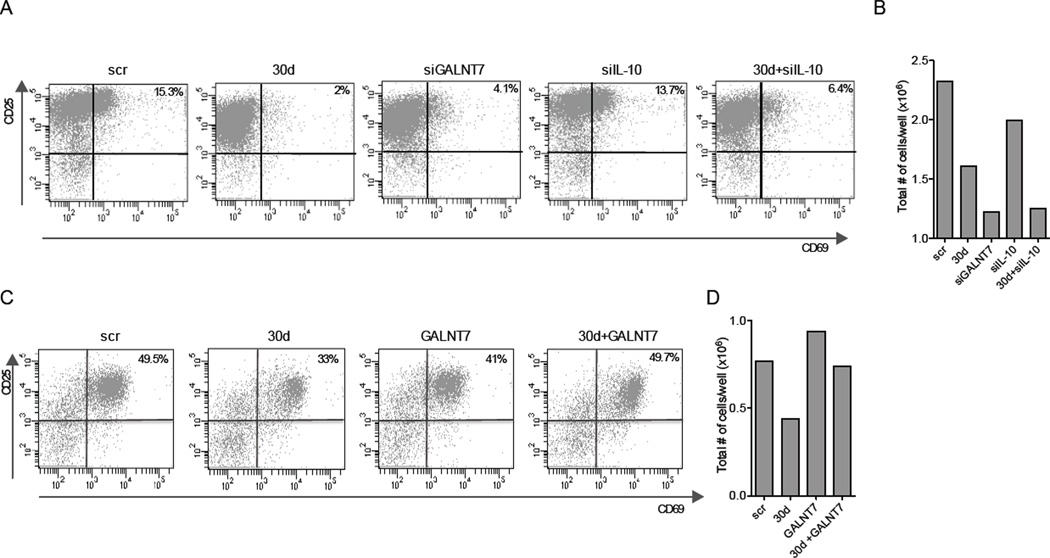
To metastasize, a tumor cell must acquire abilities such as the capacity to colonize new tissue and evade immune surveillance. Recent evidence suggests that microRNAs can promote the evolution of malignant behaviors by regulating multiple targets. We performed a microRNA analysis of human melanoma, a highly invasive cancer, and found that miR-30b/30d upregulation correlates with stage, metastatic potential, shorter time to recurrence, and reduced overall survival. Ectopic expression of miR-30b/30d promoted the metastatic behavior of melanoma cells by directly targeting the GalNAc transferase GALNT7, resulted in increased synthesis of the immunosuppressive cytokine IL-10, and reduced immune cell activation and recruitment. These data support a key role of miR-30b/30d and GalNAc transferases in metastasis, by simultaneously promoting cellular invasion and immunosuppression.


Conflict of interest statement

DISCLOSURE OF POTENTIAL CONFLICTS OF INTEREST. The authors declare no conflict of interest.

Figures

Fig. 1
Fig. 1. miR-30b and miR-30d overexpression is associated with metastatic behavior in melanoma, shorter time to recurrence, and lower overall survival
A. Increased relative levels of miR-30b and miR-30d in 17 metastatic cases compared to the levels in their matched primary tumors, as measured by quantitative RT-PCR. B–C. MiR-30b and miR-30d normalized array levels in 92 primary cases with (B) increased thickness and (C) increased stage. ANOVA test was applied in B. D. MiR-30b and miR-30d normalized array levels in superficial spreading melanomas (SSM; n=28) vs. nodular melanoma (NM; n=56). E–F. Graphs show shorter time to recurrence (E) and lower overall survival (F; n=92) in patients with high (above median value) as opposed to low (below median value) miR-30b/30d levels. (*p<0.05; ** p<0.01; ***p<0.001). See also Figure S1 and Table S1.
Fig. 2
Fig. 2. MiR-30b and miR-30d promote melanoma invasion and metastasis in vitro and in vivo
A. Transwell invasion assay of indicated cell lines with miR-30b, -30d, or both, either silenced or overexpressed (mean ±SEM). scr = scrambled control. B–C. In vivo metastasis assay with B16F10 mouse melanoma cells transfected with scr, anti-miR-30d or miR-30d mimics injected through the lateral tail vein of C57BL/6J mice. Histogram in (B) shows that anti-miR-30d suppressed metastasis, while miR-30d increased metastatic behavior (C); (mean ±SEM). Right: macroscopic pictures of mouse lungs and H&E-stained sections of lung metastases at termination of the experiment. Black dotted circles mark metastatic foci. D. Transwell invasion assay with primary melanoma cell lines WM98 and WM35 transduced with scrambled control or miR-30d (mean ±SEM). E. In vivo metastasis assay with WM98 melanoma cells stably transduced with GIPZ-scr or GIPZ-miR-30d injected through the lateral tail vein of NOG/SCID mice. Histogram shows the percentage of mice that developed lung metastases in each cohort. Whisker plots show the distribution of the number of metastases per section. Representative H&E-stained sections of lungs are shown. Scale bars represent 100µm. Black dotted circles mark metastatic foci. F–H. Pre-clinical model of human melanoma metastasis. 5B1 cells stably transduced with either scr or miR-30d vectors, were injected sub-cutaneously into the flanks of NOG/SCID mice. F. H&E-stained sections show increased local invasion of miR-30d-transduced tumors. Histogram represents the percentage of mice in each cohort with primary tumors that invaded grossly into the leg. G–H. Representative micrographs of H&E-stained sections of lungs (G) or livers (H). Histograms show the percentage of mice that developed lung or liver metastases in each cohort. Whisker plots show the distribution of the number or size (largest in each section) of metastasis per section. Bars represent the median value (*p<0.05; ** p<0.01; ***p<0.001). For all micrographs scale bars represent100µm. See also Fig. S2.
Fig. 3
Fig. 3. MiR-30b/30d directly targets SEMA3A, TWF1, CESLR3, GALNT7 and GALNT1
A–C Microarray analysis performed in independent biological duplicates for each indicated cell line. A. Heatmap showing the average normalized relative expression levels of genes involved in cell-cell/ECM contacts, motility, metastasis, immune response, or angiogenesis in the indicated cell lines transfected with either scr or miR-30d mimics. B. Venn diagram depicting the overlap between predicted miR-30d targets (TargetScan) and probes significantly downregulated in response to miR-30d overexpression in two cell lines. C. Venn diagram illustrating the overlap between predicted targets of an unrelated miRNA (miR-199a-3p) and genes significantly downregulated in response to miR-30d overexpression in two cell lines. D. Heatmap depicting the expression levels of selected predicted targets in 18 human metastatic melanoma tissues with increasing levels of miR-30d. Each column represents an average expression of 4–8 samples with similar miR-30d levels. See also Figure S4. E. Reporter assay in 293T cells transfected with miR-30b or miR-30d and constructs carrying the luciferase cDNA fused to the 3’UTR of selected predicted targets (mean ±SEM). F. Reporter assay in 293T cells transfected with luciferase constructs fused to the 3’UTR of GALNT7, GALNT1, SEMA3A, CESLR3 and TWF1 and significantly lower concentrations of miR-30b/30d. G–H. Reporter assay in 293T cells transfected with luciferase constructs carrying GALNT7, GALNT1 and SEMA3A 3’UTRs mutated in miR-30b/30d binding sites. DM= double mutant (mean ±SEM). (*p<0.05; ** p<0.01; ***p<0.001).
Fig. 4
Fig. 4. GALNT modulation accounts for miR-30d pro-invasive effects in vitro and in vivo
A–B. Transwell invasion assay of indicated cell lines transfected with scr, miR-30d, siGALNT7, siGALNT1, GALNT7 cDNA, or co-transfected with miR-30d and GALNT7 cDNA (mean ±SEM). C–D. In vivo metastasis assay with B16F10 mouse melanoma cells. C. Cells were transfected with scr, miR-30d mimics or siGALNT7 oligos and injected through the lateral tail vein of C57BL/6J mice. Levels of knockdown or over expression are shown on the left. Histogram and macroscopic pictures are shown. D. Cells were stably transduced with either pEIGW-Empty or pEIGW-mmuGALNT7. 24 hours prior to injection, cells were transfected with either scr control or miR-30d oligonucleotides. Cells were injected through the lateral tail vein of NOG/SCID mice. Levels of overexpression are shown on the left. Histogram and representative macroscopic pictures are depicted (mean ±SEM; *p<0.05; ** p<0.01; ***p<0.001). See also Fig. S3.
Fig. 5
Fig. 5. GALNT modulation accounts for miR-30d-mediated alterations in membranous O-linked glycans
A–B. Lectin microarray analysis of 5B1 cells transiently transfected with scrambled control, miR-30d, siGALNT7, or co-transfected with both miR-30d and GALNT7 cDNA. C. Array spots (in triplicates) showing raw signal intensities of galactosamine- or N-Acetylgalactosamine (Gal/GalNAc)-, fucose- or sialic acid-binding lectins in the four treatment groups. The similarities and differences are quantitated in the histogram that represents the average relative binding signal intensity of the lectins depicted above (mean±SEM). D. Heatmap representing normalized signal intensity of a dual color lectin array. Each treatment sample (labeled with Cy3) was hybridized in a 1:1 molar ratio with a scr sample (labeled with Cy5) as internal control. See also Fig. S5.
Fig. 6
Fig. 6. MiR-30d promotes IL-10 secretion by suppressing GALNT7
A. Levels of IL-10 in melanoma cells transduced with miR-30d relative to scr control measured by cytokine array. Quantification of signal density is presented on the right. B. Levels of phosphorylation of proteins that might explain the increase in IL-10 secretion from miR-30d-transfected cells as measured by solid phase ELISA in indicated cell lines. Inset: levels of IL-10 secreted from the cells, quantified by ELISA (mean ±SEM). C. Western blot of phospho-STAT3 levels in scr or miR-30d-transfected cells. Tubulin served as loading control. D. IL-10 mRNA levels in siGALNT7-transfected melanoma cell lines 4L and 5B1 relative to scr control as measured by qRT-PCR (mean ±SEM). E. Secretion of IL-10 to the supernatant of siGALNT7-transfected melanoma cell lines 4L and 5B1 as compared to scr-transfected cells, measured by ELISA. F. IL-10 mRNA (measured by qRT-PCR) levels in indicated melanoma cells transfected with scr, GALNT7 cDNA, or co-transfected with both miR-30d and GALNT7. (mean ±SEM). *p<0.05). See also Fig. S6.
Fig. 7
Fig. 7. MiR-30d associates with enhanced immunosuppressive features at the metastatic site
A. Representative flow cytometry of regulatory T cells (CD4+ CD25+ Foxp3+) isolated from whole lungs of mice injected with B16F10/scr or B16F10/miR-30d (mean ± SEM). Isotype controls are shown on the left for each treatment group. See also Table S2. B. CD4 mRNA levels in macrometastases dissected from B16F10/miR-30d relative to B16F10/scr injected mice (mean ±SEM). C. Foxp3 mRNA expression in macro-dissected metastases extracted from lungs of mice injected with B16F10/miR-30d relative to B16F10/scr injected mice (mean ±SEM). D. CD3 immunofluorescence staining of metastases of B16F10/mir-30d and B16F10/scr- injected mice shows recruitment of T cells to scr-transfected compared to B16F10/miR-30d transfected metastasis. Corresponding H&E stainings on consecutive sections are shown in upper panels and metastatic foci are circled. Scatter plot depicts the number of recruited CD3+ T cells to the metastasis in several mice per group. The number of cells was normalized to the area of metastasis. E. FoxP3 immunofluorescence staining shows recruitment of regulatory T lymphocytes to B16F10/miR-30d compared to B16F10/scr metastases. Corresponding H&E stainings on consecutive sections are shown in upper panels and metastatic foci are circled. Scatter plot depicts the number of recruited CD3+ T cells to the metastasis in several different mice for each group. Scale bars represent 100µm (*p<0.05; ** p<0.01). See also Fig. S7.
Fig. 8
Fig. 8. GALNT modulation accounts for miR-30d-mediated immunosupressive effects ex vivo
A. FACS analysis of activated (CD25+CD69+ gated on CD4+) T lymphocyes isolated from spleens of Foxp3-GFP mice, stimulated by CD28 and CD3 antibodies and incubated for 72h in the presence of supernatants from A375 melanoma cells transfected with scr, miR-30d, siGALNT7, siIL10 and miR-30d+siIL-10. B. Total number of T cells at conclusion of the experiment (representative experiment, n=3). C. FACS analysis of activated (CD25+CD69+ CD4+) T lymphocytes isolated from spleens of Foxp3-GFP mice, stimulated by CD28 and CD3 antibodies and incubated for 72h in the presence of supernatants from 5B1 melanoma cells transfected with scr+pCDNA3-Empty (scr), miR-30d+pCDNA3-Empty (30d), scr+pCMV-GALNT7 (GALNT7) and miR-30d+pCMV-GALNT7 (30d+GALNT7). D. Total number of T cells at conclusion of the experiment (a representative experiment).

References

    1. Bettelli E, Carrier Y, Gao W, Korn T, Strom TB, Oukka M, Weiner HL, Kuchroo VK. Reciprocal developmental pathways for the generation of pathogenic effector TH17 and regulatory T cells. Nature. 2006;441:235–238. - PubMed
    1. Bhavanandan VP. Cancer-associated mucins and mucin-type glycoproteins. Glycobiology. 1991;1:493–503. - PubMed
    1. Bogunovic D, O'Neill DW, Belitskaya-Levy I, Vacic V, Yu YL, Adams S, Darvishian F, Berman R, Shapiro R, Pavlick AC, et al. Immune profile and mitotic index of metastatic melanoma lesions enhance clinical staging in predicting patient survival. Proc Natl Acad Sci U S A. 2009;106:20429–20434. - PMC - PubMed
    1. Brockhausen I. Mucin-type O-glycans in human colon and breast cancer: glycodynamics and functions. EMBO Rep. 2006;7:599–604. - PMC - PubMed
    1. Calin GA, Croce CM. MicroRNA signatures in human cancers. Nat Rev Cancer. 2006;6:857–866. - PubMed

Publication types

MeSH terms

Associated data