. 2011 Jul 12;20(1):119-31.
doi: 10.1016/j.ccr.2011.05.026.

Targeting androgen receptor in estrogen receptor-negative breast cancer

Affiliations

Targeting androgen receptor in estrogen receptor-negative breast cancer

Min Ni et al. Cancer Cell. .

Abstract

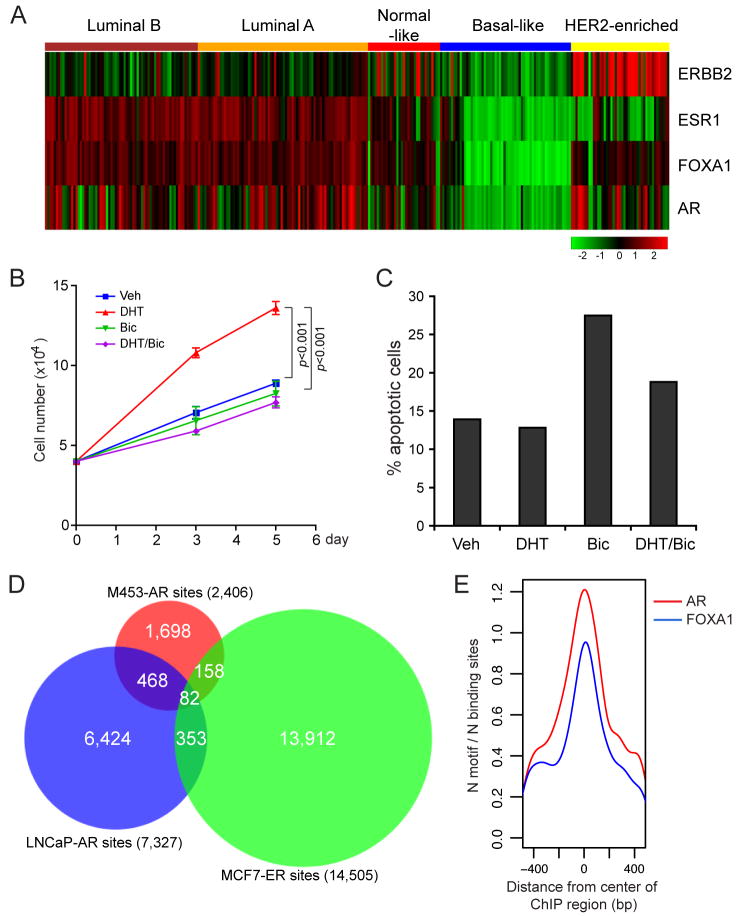
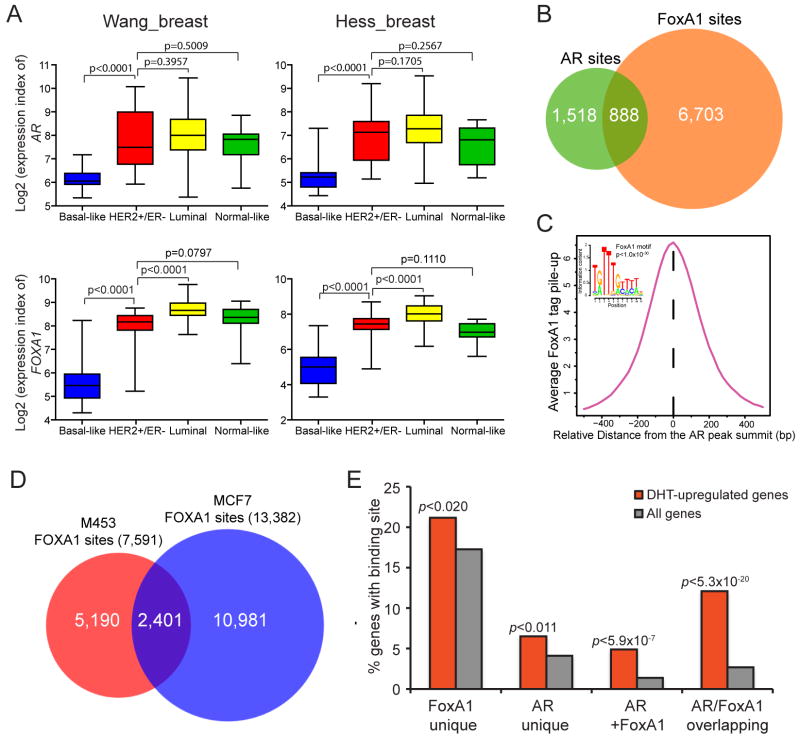
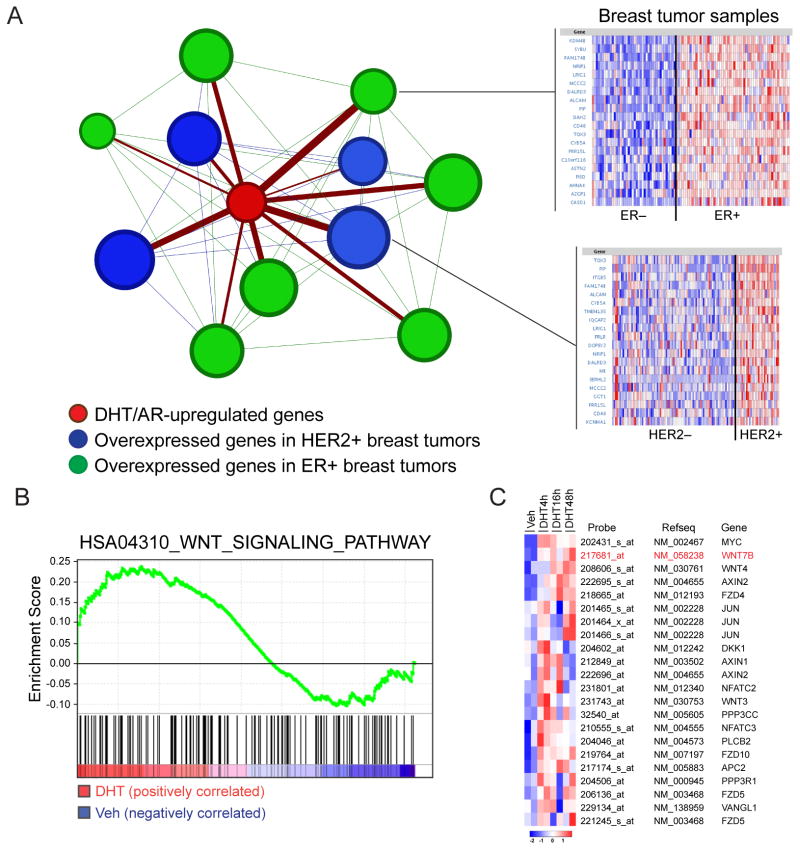
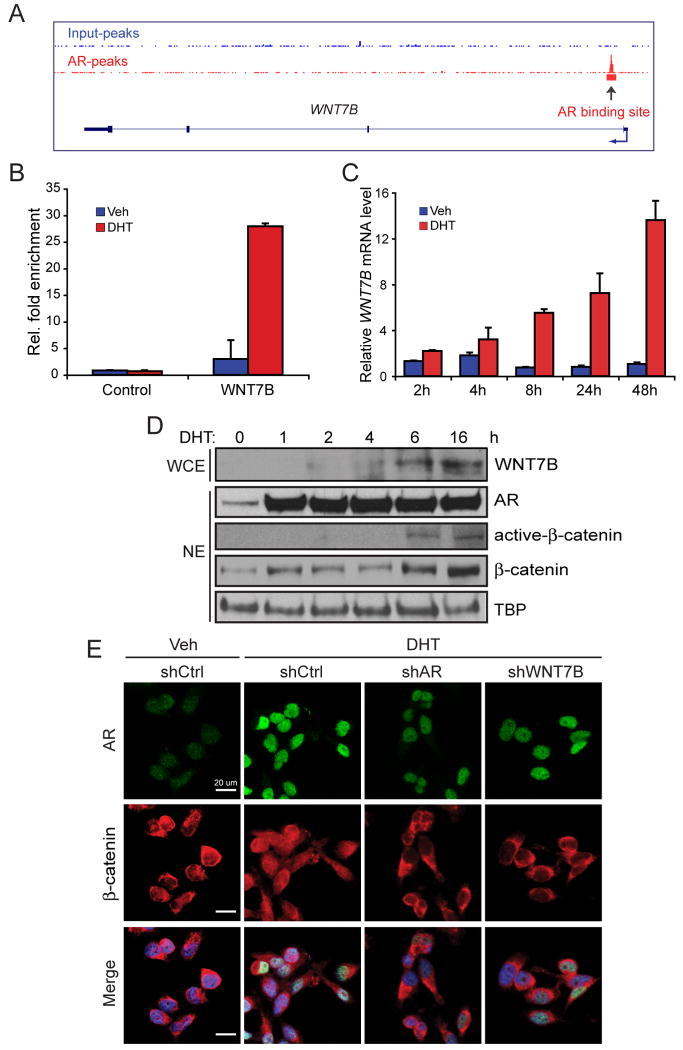
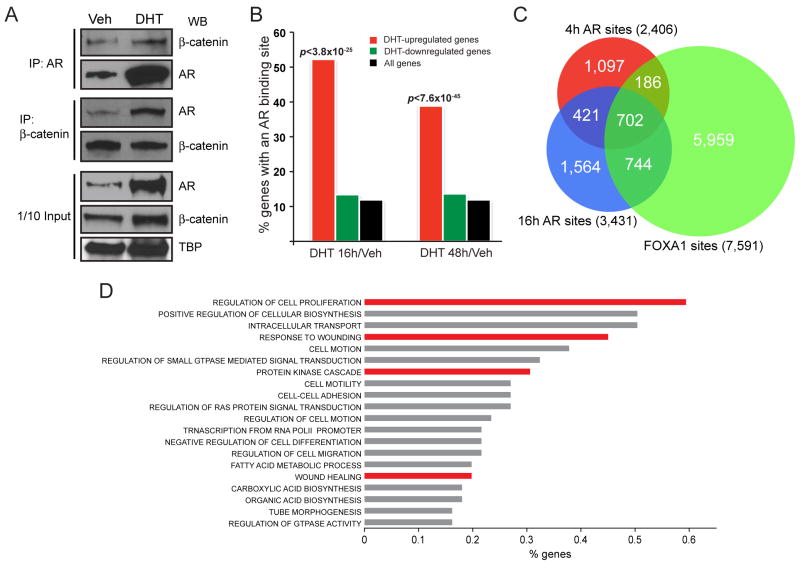
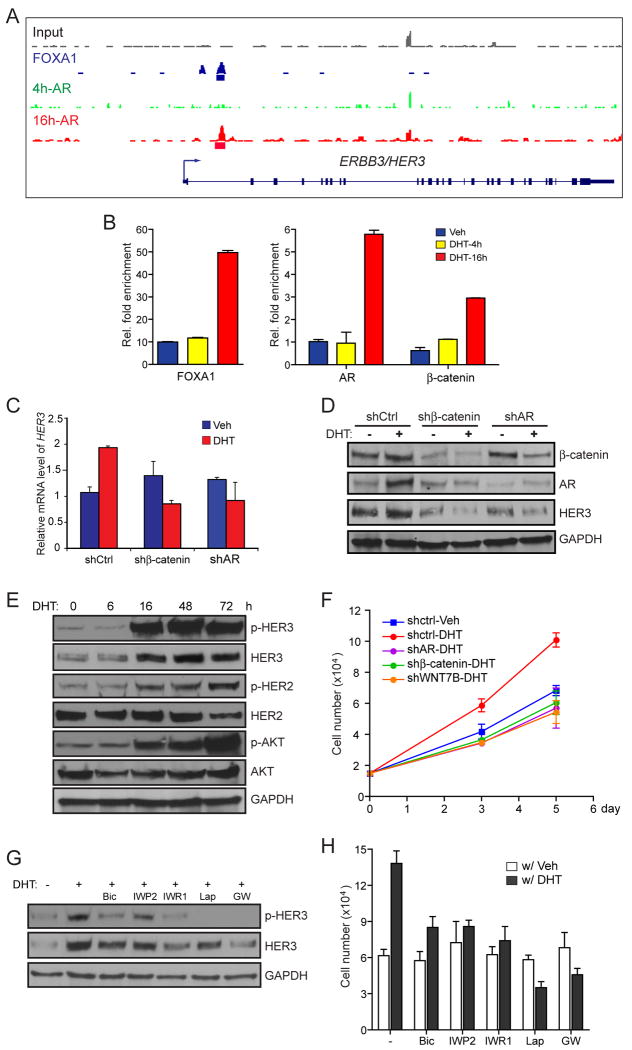
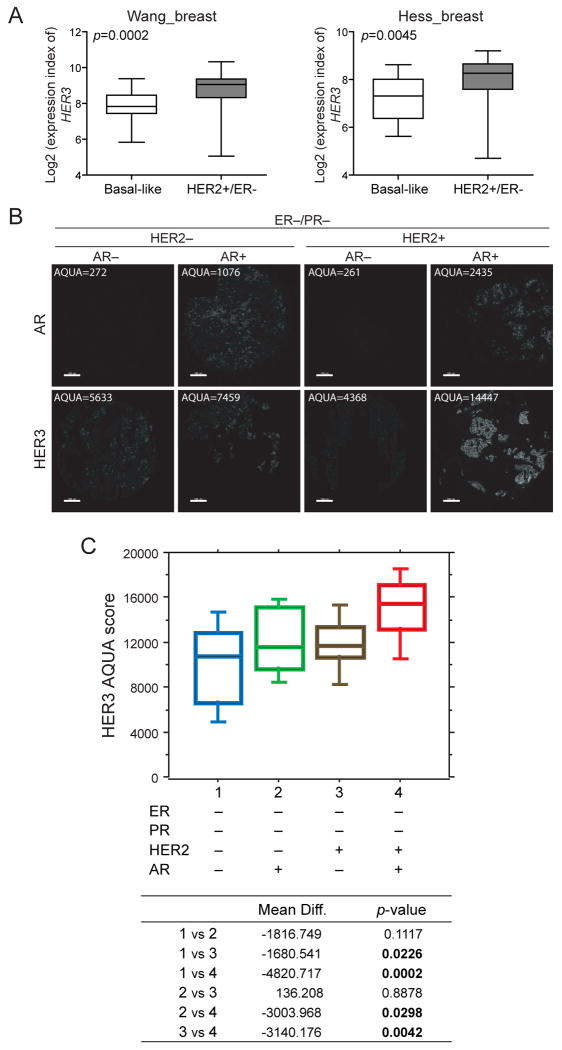
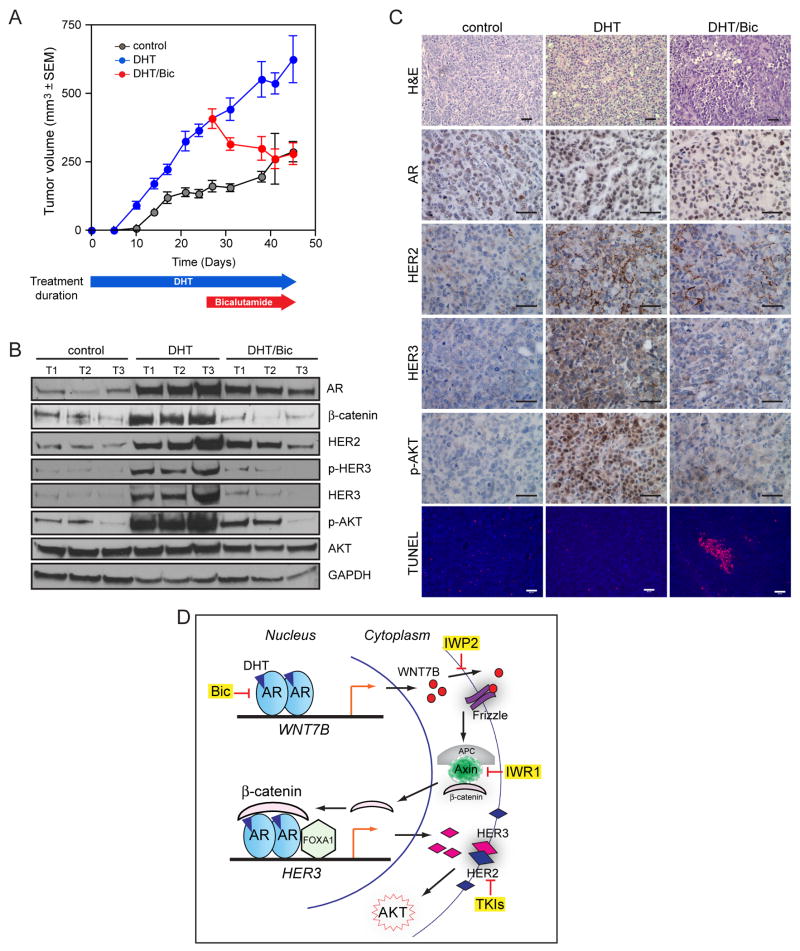
Endocrine therapies for breast cancer that target the estrogen receptor (ER) are ineffective in the 25%-30% of cases that are ER negative (ER-). Androgen receptor (AR) is expressed in 60%-70% of breast tumors, independent of ER status. How androgens and AR regulate breast cancer growth remains largely unknown. We find that AR is enriched in ER- breast tumors that overexpress HER2. Through analysis of the AR cistrome and androgen-regulated gene expression in ER-/HER2+ breast cancers we find that AR mediates ligand-dependent activation of Wnt and HER2 signaling pathways through direct transcriptional induction of WNT7B and HER3. Specific targeting of AR, Wnt or HER2 signaling impairs androgen-stimulated tumor cell growth suggesting potential therapeutic approaches for ER-/HER2+ breast cancers.


Figures

Figure 1
Figure 1. Androgen receptor is functionally active in ER−/HER2+ breast cancer
(A) Heatmap of a breast cancer microarray dataset (Wang et al., 2005a) showing the expression levels of ERBB2/HER2, ESR1, AR and FOXA1 across the five breast cancer subtypes classified by the PAM50 gene signature. The AR expression is highly correlated with HER2 status of ER− breast tumors (rPearson>0.69, p<6.6×10⁻¹¹). (B) DHT stimulates the growth of MDA-MB-453 breast cancer cells and the AR antagonist bicalutamide (Bic) abrogates this effect. Data represent means +/- standard deviation (SD) from three independent replicates. Unpaired two-tail t-test was used to examine the statistical difference and p-values are shown. (C) Annexin-V apoptosis assay detects increased apoptosis induced by bicalutamide (Bic) in MDA-MB-453 breast cancer cells. (D) Venn diagram showing the overlap between AR cistromes from MDA-MB-453 breast cancer cells and LNCaP prostate cancer cells (Wang et al., 2009) together with the ER cistrome from MCF7 breast cancer cells (Ross-Innes et al., 2010). (E) Enrichment for the AR and FOXA1 binding motifs in the center of the AR binding sites specific to MDA-MB-453 cells. The occurrence of the motifs (N motifs) was normalized to the number of sites of the AR cistrome (N binding sites). See also Figure S1.
Figure 2
Figure 2. FOXA1 collaborates with AR in control of DHT signaling in ER−/HER2+ breast cancer
(A) Comparison of AR and FOXA1 expression between ER−/HER2+ and basal-like, luminal or normal-like breast cancer subtypes using published microarray datasets (Hess et al., 2006; Wang et al., 2005a). Unpaired two-tail t-test is used for p value calculation. The FOXA1 expression is highly correlated with AR levels within ER−breast tumors (rPearson>0.76, p<2×10⁻¹⁰). (B) Venn diagram of the overlap between AR and FOXA1 cistromes. (C) Sitepro analysis (Shin et al., 2009) of the genome-wide correlation between AR and FOXA1 binding sites. The average ChIP-seq signal is shown for the 1-kb region surrounding the center of AR binding sites. (D) Venn diagram showing the overlap between hormone-stimulated FOXA1 cistromes from MDA-MB-453 and MCF7 (Eeckhoute et al., 2009) breast cancer cells. (E) Correlation between DHT-upregulated gene expression and binding of AR only (AR unique), FOXA1 only (FOXA1 unique), the two factors at non-overlapped but nearby sites (AR+FOXA1), and the two factors at the overlapped sites (AR/FOXA1 overlapping), within 50 kb of the TSS of genes. p values are shown. See also Figure S2.
Figure 3
Figure 3. Characterization of DHT-induced gene signature in ER−/HER2+ breast cancer cells
(A) Oncomine Concepts Map analysis (Compendia Biosciences Inc.) was used to compare the DHT/AR-induced gene signature in MDA-MB-453 cells against all published gene signatures from primary breast tumors, and reveals statistically significant correlations between DHT-induced genes specifically associated with AR binding sites within 50 kb of their TSS and gene expression signatures of HER2+ breast tumors as well as ER+ breast tumors. In the left panel, The association between molecular concepts of different gene signatures or gene sets is represented as a graph using Gephi (http://gephi.org/), in which a node represents a gene set and significantly associated sets (q≤2.3×10⁻⁴) were connected by an edge. The node of AR-upregulated gene set was colored in red, and the nodes of overexpression gene sets from HER2+ or ER+ breast tumors were colored in blue and green, respectively. The thickness of the edges that connect the node of AR-upregulated gene set with other nodes is proportional to the rank of the association significance. The size of a node is proportional to the number of overlapping genes between its corresponding gene sets and AR-upregulated gene set. The right panel presents examples of the significant correlation between the DHT/AR-induced gene signature with the published ER+ breast cancer gene signature and HER2+ breast cancer gene signature established in two independent studies (Bonnefoi et al., 2007; Minn et al., 2005). (B) Plot from gene set enrichment analysis (GSEA) (Subramanian et al., 2005) showing enrichment of the Wnt pathway in DHT-upregulated transcription program. (C) Gene expression microarray heatmap showing the DHT-induced expression of genes involved in the Wnt signaling pathway. See also Figure S3.
Figure 4
Figure 4. AR-mediated transcriptional upregulation of WNT7B activates β-catenin
(A) Schematic diagram of the AR binding site within the WNT7B gene locus (+1 kb of TSS) as defined by AR ChIP-seq. (B) Direct AR ChIP followed by quantitative PCR after treatment with vehicle (blue bars) or 10 nM DHT (red bars) for 4h in MDA-MB-453 breast cancer cells. Primers flanking GAPDH promoter region were used as a control. Data represent means with SD. (C) WNT7B mRNA level was determined by real-time RT-PCR after MDA-MB-453 cells were treated with vehicle (blue bars) or 10 nM DHT (red bars) for the indicated times. mRNA levels are presented as means with SD. (D) Whole cellular extracts (WCE) or nuclear extracts (NE) from vehicle or DHT-treated MDA-MB-453 cells were subjected to immunoblotting for the indicated proteins. (E) Confocal immunofluorescence microscopy showing endogenous AR (green) and β-catenin (red) in lentiviral shRNA-transfected MDA-MB-453 cells after treatment with vehicle (Veh) or 10 nM DHT for 3 days in hormone-depleted medium. DAPI staining indicates the nucleus. Scale bars represent 20 μM. See also Figure S4.
Figure 5
Figure 5. Prolonged DHT-stimulation leads to a distinct AR cistrome in ER−/HER2+ breast cancer cells
(A) Co-immunoprecipitation of endogenous AR and β-catenin from the nuclear extracts of MDA-MB-453 breast cancer cells after 4h stimulation with vehicle (Veh) or 10 nM DHT. (B) Correlation between DHT-regulated genes and 16h-AR cistrome in MDA-MB-453 breast cancer cells. (C) Venn diagram showing the overlap between AR and FOXA1 cistromes in MDA-MB-453 breast cancer cells. (D) Functional annotation of the genes that uniquely possess overlapped 16h-AR and FOXA1 binding sites. Top overrepresented gene categories (p≤0.05) from Gene Ontology (GO) Biological Process are shown and the categories involving HER3 are colored in red.
Figure 6
Figure 6. AR-regulated HER3 induction activates HER2/HER3 signaling pathway in ER−/HER2+ breast cancer cells
(A) Schematic representation showing the overlapped AR and FOXA1 binding site within the HER3 gene locus as defined by ChIP-seq in MDA-MB-453 breast cancer cells. (B) Recruitment of FOXA1, AR and β-catenin to the regulatory region of HER3 (+1.8 kb of TSS). Direct ChIP-qPRC of FOXA1, AR and β-catenin was performed to monitor their binding at HER3 gene after MDA-MB-453 cells were treated with vehicle or 10 nM DHT for 4h or 16h. Data represent means with SD. (C) MDA-MB-453 cells transduced with the indicated shRNA lentivirus were treated with vehicle or DHT for 16 h, and the total RNA was subjected to real-time RT-PCR of HER3. mRNA levels are presented as means with SD. (D) Immunoblotting to determine HER3 expression in MDA-MB-453 cells after transduction of the indicated lentiviral shRNA followed by vehicle (−) or DHT (+) treatment for 16h in hormone-depleted medium. (E) MDA-MB-453 breast cancer cells were treated with 10 nM DHT for the indicated times and assayed for expression and phosphorylation of the indicated proteins. (F) Lentiviral shRNA-transduced MDA-MB-453 cells were cultured in hormone-depleted medium for 2 days followed by treatment with vehicle (Veh) or 10 nM DHT for the indicated time points, and the total numbers of viable cells were determined. The results are shown as means +/- SD from three independent replicates. (G) MDA-MB-453 cells were treated with the indicated agents for 48h and HER3 and HER3 phosphorylation were measured by immunoblotting. (H) After treatment with the indicated inhibitors in the presence of vehicle or 10 nM DHT for 3 days, the total numbers of viable cells were determined and the means from three independent replicates are shown with SD. See also Figure S5.
Figure 7
Figure 7. Coexpression of AR and HER3 in ER−/HER2+ breast tumors
(A) Comparison of HER3 expression between ER−/HER2+ and basal-like breast cancer subtypes using published microarray datasets (Hess et al., 2006; Wang et al., 2005a). Unpaired two-tail t-test is used for p value calculation. The HER3 expression is highly correlated with AR levels of ER−/HER2+ tumors (rPearson>0.41, p<2.8×10⁻⁴). (B) Representative AQUA output images of tissue microarray staining analysis for the four subtypes of ER−/PR− breast tumors based on AR (cutpoint >800) and HER2 status. AQUA scores are shown and the scale bars represent 100 μM. (C) Quantitation of HER3 staining in the four subtypes, HER2−/AR− (n=93), HER2−/AR+ (n=12), HER2+/AR− (n=32) and HER2+/AR+ (n=10) of ER−/PR− breast tumor samples by AQUA. p values were based on two-sided testing, and p<0.05 was considered as statistically significant.
Figure 8
Figure 8. Bicalutamide impedes DHT-induced tumor growth in vivo
(A) Effects of DHT and bicalutamide on the growth of MDA-MB-453 xenograft tumors. MDA-MB-453 cells were orthotopically implanted in the 4th inguinal gland of female NOD/SCID mice and the DHT release pellets were implanted subcutaneously at the same time in the surgery. Animals bearing tumors (> 400 mm3 in size) were randomly grouped (8-10 mice per group) and treated with daily oral gavage of vehicle or bicalutamide (10 mg/kg) for three weeks. Data are presented as mean tumor volume +/- SEM. (B) Immunoblot analysis of MDA-MB-453 xenograft tumors from different treatment groups to examine the expression or phosphorylation of the indicated proteins. The whole cell extracts subjected to immunoblotting were prepared from three tumor samples for each group that were collected from three mice respectively. (C) The paraffin-embedded tumor sections were subjected to histological analysis by H&E staining, immunohistochemical staining of the indicated proteins and TUNEL assays for in situ cell death detection. Scale bars represent 50 μM. (D) Model of the regulatory role of AR in activating WNT7B/β-catenin and HER2/HER3 in ER−/HER2+ breast cancer. The inhibitors targeting AR, Wnt or HER2 pathways are highlighted in yellow.

Similar articles

Cited by

References

    1. Agoff SN, Swanson PE, Linden H, Hawes SE, Lawton TJ. Androgen receptor expression in estrogen receptor-negative breast cancer. Immunohistochemical, clinical, and prognostic associations. Am J Clin Pathol. 2003;120:725–731. - PubMed
    1. Baselga J, Swain SM. Novel anticancer targets: revisiting ERBB2 and discovering ERBB3. Nat Rev Cancer. 2009;9:463–475. - PubMed
    1. Bernardo GM, Lozada KL, Miedler JD, Harburg G, Hewitt SC, Mosley JD, Godwin AK, Korach KS, Visvader JE, Kaestner KH, et al. FOXA1 is an essential determinant of ERalpha expression and mammary ductal morphogenesis. Development. 2010;137:2045–2054. - PMC - PubMed
    1. Bonnefoi H, Potti A, Delorenzi M, Mauriac L, Campone M, Tubiana-Hulin M, Petit T, Rouanet P, Jassem J, Blot E, et al. Validation of gene signatures that predict the response of breast cancer to neoadjuvant chemotherapy: a substudy of the EORTC 10994/BIG 00-01 clinical trial. Lancet Oncol. 2007;8:1071–1078. - PubMed
    1. Brisken C, Heineman A, Chavarria T, Elenbaas B, Tan J, Dey SK, McMahon JA, McMahon AP, Weinberg RA. Essential function of Wnt-4 in mammary gland development downstream of progesterone signaling. Genes Dev. 2000;14:650–654. - PMC - PubMed

Publication types

MeSH terms