. 2011;271(1):104-9.
doi: 10.1016/j.cellimm.2011.06.011. Epub 2011 Jun 17.

Melanoma-induced suppression of tumor antigen-specific T cell expansion is comparable to suppression of global T cell expansion

Affiliations

Melanoma-induced suppression of tumor antigen-specific T cell expansion is comparable to suppression of global T cell expansion

Andrew J Russ et al. Cell Immunol. 2011.

Abstract

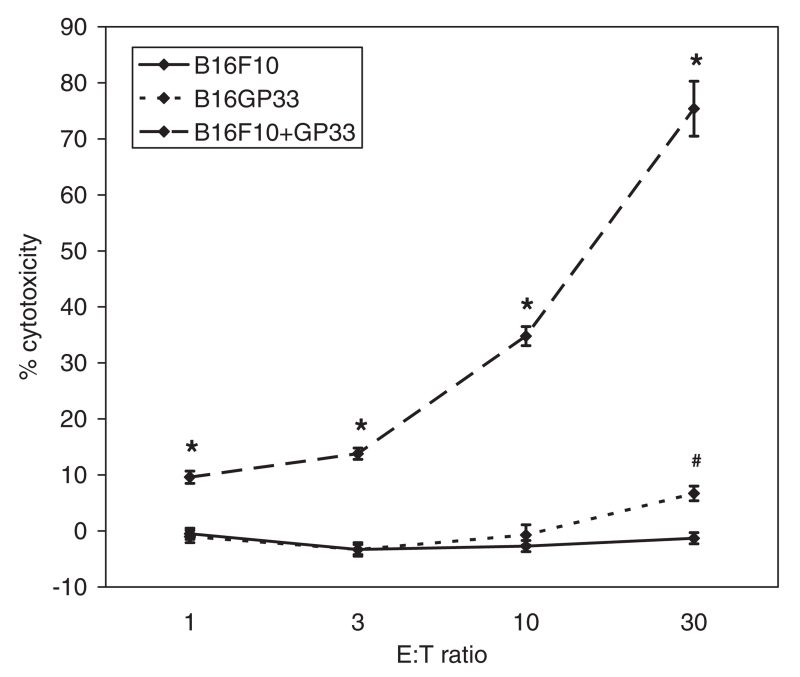
We have observed that in vivo interaction between melanoma and resting T cells promotes suppression of antigen-driven proliferative T cell expansion. We hypothesized that this suppression would affect tumor antigen-specific T cell populations more potently than tumor-unrelated T cell populations. A B16F10 cell line was stably transfected to express low levels of the lymphocytic choriomeningitis virus (LCMV) glycoprotein GP33 (B16GP33). Mice bearing B16F10 or B16GP33 tumors were infected with LCMV, and proliferative expansion of LCMV epitope-specific T cell populations was quantified. In vitro and in vivo assays confirmed low levels of antigenic GP33 expression by B16GP33 tumors. Suppressed expansion of GP33-specific T cells was equivalent between mice bearing B16F10 and B16GP33 tumors. These observations suggest that the ability of growing melanoma tumors to impair antigen-driven proliferative expansion of activated T cells is global and not antigen-specific, and provide further insight into the influence of cancer on activated T cell homeostasis.


Figures

Fig. 1
Fig. 1
Chromium release assays were performed by incubating splenocytes from C57BL/6 mice 8 days after LCMV infection (effector cells) with B16F10 cells, B16GP33 cells, or B16F10 cells exogenously supplemented with 1 μg/mL GP33 peptide (“B16F10 + GP33”) (target cells) previously labeled with 200 μCi 51Cr at the indicated effector:target (“E:T”) ratios at 37 °C for 4 h. Percent cytotoxicity was calculated based on experimental release of 51Cr under experimental conditions, spontaneous release when target cells were incubated with media alone, and maximal release when target cells were incubated with centrimide (see Section 2). This experiment was repeated two times with identical results. (Error bars denote standard error of the mean; * denotes p < 0.05 of B16F10 + GP33 compared with B16F10; # denotes p < 0.05 of B16GP33 compared with B16F10).
Fig. 2
Fig. 2
Splenocytes harvested from C57BL/6 mice 8 days after LCMV infection were coincubated with B16F10 cells, B16GP33 cells, and B16F10 cells exogenously supplemented with the indicated concentration of GP33 peptide in the presence of brefeldin A and 10U IL-2 at 37 °C for 5 h. Splenocytes were then collected and CD8+ T cells were analyzed for intracellular levels of IFNγ expression by flow cytometry. This experiment was repeated three times with identical results. (Error bars denote standard error of the mean; * denotes p < 0.05 of B16GP33 compared with B16F10; # denotes p < 0.05 of B16GP33 compared with B16F10 + 10−4 μg/mL GP33 peptide, + denotes p < 0.05 of B16GP33 compared with B16F10 + 10−3 μg/mL GP33 peptide; NS denotes p > 0.05 between indicated groups).
Fig. 3
Fig. 3
106 B16F10 or B16GP33 cells were suspended in serum-free media and administered as subcutaneous inocula into C57BL/6 mice (n = 6 mice per group). Tumor size was measured every three days. This experiment was repeated four times with identical results. (Error bars denote standard error of the mean).
Fig. 4
Fig. 4
106 B16F10 or B16GP33 cells were suspended in serum-free media and administered as subcutaneous inocula into C57BL/6 mice 8 days after LCMV infection (n = 5 mice per group). Tumor size was measured every three days. This experiment was repeated four times with identical results. (Error bars denote standard error of the mean; * denotes p < 0.05 of B16GP33 compared with B16F10).
Fig. 5
Fig. 5
106 B16F10 or B16GP33 cells were suspended in serum-free media and administered as subcutaneous inocula into C57BL/6 mice (n = 5 mice per group). On day 10, all mice were infected with LCMV. Tumor size was measured every three days. This experiment was repeated four times with identical results. (Error bars denote standard error of the mean; * denotes p < 0.05 of B16GP33 compared with B16F10).
Fig. 6
Fig. 6
(A) C57BL/6 mice were inoculated with serum-free media (“no tumor”) or 106 B16F10 or B16GP33 cells, then infected with LCMV on day 10, and euthanized on day 18 for splenocyte harvest (n = 6 mice per group). Splenocytes were stained with anti-CD8 antibodies and Db MHC class I tetramers loaded with LCMV epitope peptides, then analyzed by flow cytometry (upper panel). Alternatively, splenocytes were stimulated in vitro with LCMV epitope peptides, or left unstimulated as a negative control, for 5 h in the presence of brefeldin A and IL-2, stained with antibodies against CD8 and intracellular IFNγ, and analyzed by flow cytometry (lower panel). These representative plots are gated on total viable splenocytes and the highlighted populations indicate the percentage of CD8+ T cells specific for the immunodominant LCMV epitope peptide NP396. (B) Absolute numbers of CD8+ T cells (percent of tetramer-positive cells multiplied by total numbers of splenocytes) specific for NP396, GP33, and GP276 present 8 days after LCMV infection in control (“no tumor”), B16F10-bearing and B16GP33-bearing mice are shown. (C) Absolute numbers of CD8+ T cells expressing IFNγ in response to in vitro stimulation with NP396, GP33, GP34, and GP276 8 days after LCMV infection in control (“no tumor”), B16F10-bearing and B16GP33-bearing mice are shown. This experiment was repeated four times with identical results. (Error bars denote standard error of the mean; * denotes p < 0.05 of no tumor compared with B16F10; # denotes p < 0.05 of no tumor compared with B16GP33; NS denotes p > 0.05 between indicated groups; US denotes unstimulated negative controls).

Similar articles

Cited by

References

    1. Dunn GP, Old LJ, Schreiber RD. The three E’s of cancer immunoediting. Ann. Rev. Immunol. 2004;22:329–360. - PubMed
    1. Kim R, Emi M, Tanabe K. Cancer immunoediting from immune surveillance to immune escape. Immunology. 2007;121:1–14. - PMC - PubMed
    1. Dunn GP, Old LJ, Schreiber RD. The immunobiology of cancer immunosurveillance and immunoediting. Immunity. 2004;21:137–148. - PubMed
    1. Shankaran V, Ikeda H, Bruce AT, et al. IFNγ and lymphocytes prevent primary tumour development and shape tumour immunogenicity. Nature. 2001;410:1107–1111. - PubMed
    1. Rabinovich GA, Gabrilovich D, Sotomayor EM. Immunosuppressive strategies that are mediated by tumor cells. Ann. Rev. Immunol. 2007;25:267–295. - PMC - PubMed

Publication types

MeSH terms

LinkOut - more resources